Prop Firm DrawDown Protector : Prop Firm Capital Protection Expert MT5 | Forex Money Management: Forex Trade Management Expert MT5 | ICT Concepts Indicator MT5 |Smart Money Concepts Expert MT5 |Get a free Expert Advisor license via Telegram and WhatsApp
Pros and Cons of the Stochastic Indicator
The stochastic indicator is highly sensitive and generates more frequent signals than other momentum indicators. However, these signals are most effective when confirmed by other technical analysis tools.
- Pros:
- High sensitivity and frequent signals
- Simple and straightforward signal structure
- Applicable across all financial markets
- Easy and quick to understand
- Cons:
- Generates a relatively high number of false signals
- Can have a delay in signal issuance
- Requires complementary confirmations from other indicators
- Needs setting adjustments for different market conditions
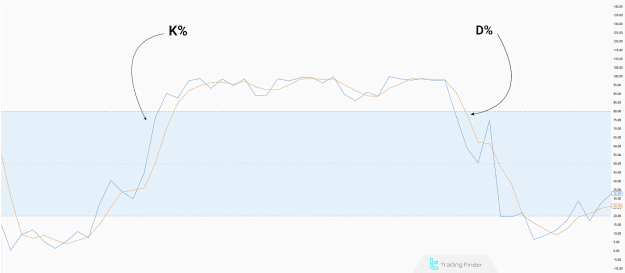
Components of the Stochastic Indicator
The indicator is composed of two primary lines, %K and %D. The crossovers of these lines are key to identifying potential price moves.
- The %K Line calculates the ratio of the current closing price to the highest and lowest prices over a defined period.
- The %D Line is a simple moving average (SMA) of the %K line, which serves to smooth out the indicator and filter noise.
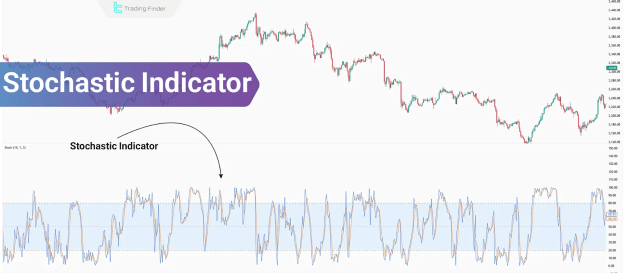
How the Stochastic Oscillator Works
The stochastic oscillator uses these two lines, the fast line (%K) and the slow line (%D), to reflect price momentum.
- A sell signal is generated when the fast line (%K) crosses below the slow line (%D).
- A buy signal is generated when the fast line (%K) crosses above the slow line (%D) from below.
The oscillator's display is divided into three zones:
- The area above 80 indicates an overbought condition, which may precede a downward trend reversal.
- The area below 20 indicates an oversold condition, which may suggest the possibility of a bullish reversal.
Stochastic Indicator Formula
The default calculation for the stochastic indicator is based on the following formula:
K=100×(C−L14)/(H14−L14)
Where:
- C = Current closing price
- L14 = Lowest price over the last 14 periods
- H14 = Highest price over the last 14 periods
Identifying Divergence Using the Stochastic Indicator
The stochastic oscillator is effective at identifying both regular and hidden divergence.
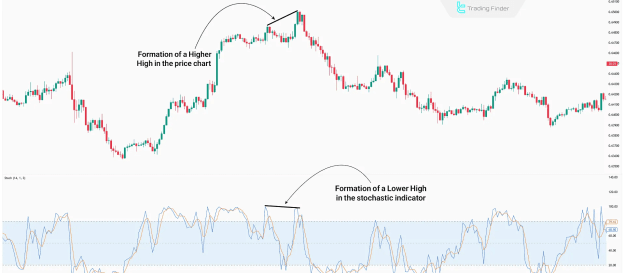
Regular Divergence in the Stochastic Indicator
Regular divergence signals a potential change in trend direction.
- A bearish regular divergence occurs in an uptrend when the stochastic indicator forms lower highs while the price chart shows higher highs.
- A bullish regular divergence occurs in a downtrend when the stochastic indicator forms higher lows while the price shows lower lows.
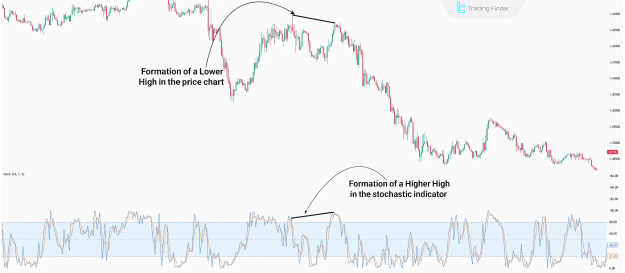
Hidden Divergence in the Stochastic Indicator
Hidden divergence suggests the continuation of the existing trend.
- A bullish hidden divergence forms in an uptrend when the price creates higher lows but the stochastic indicator shows lower lows.
- A bearish hidden divergence forms in a downtrend when the price creates lower highs while the stochastic displays higher highs.
Trading Strategy Using the Stochastic Oscillator and Candlestick Patterns
This strategy combines the stochastic indicator with candlestick patterns to enhance signal accuracy.
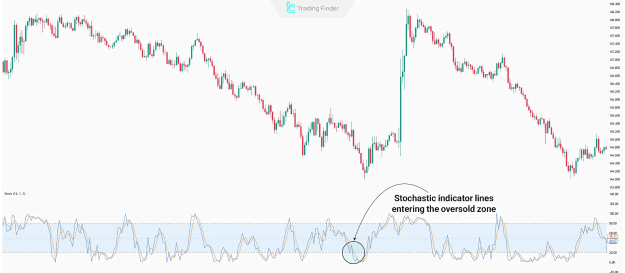
1. Stochastic Lines Enter the Extreme Zone The first step is to wait for the stochastic lines to move into either the overbought (above 80) or oversold (below 20) zones.
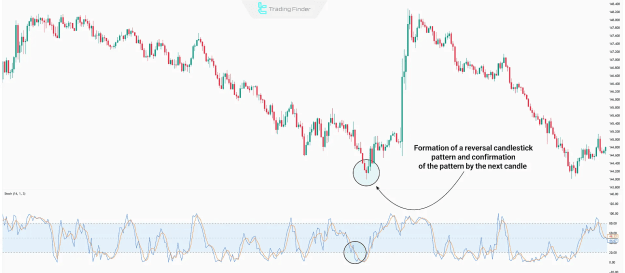
2. Formation of Candlestick Pattern Once the lines are in an extreme zone, a reversal candlestick pattern, such as a Hammer or a Shooting Star, should form on the price chart and be confirmed by the subsequent candle.
3. Trade Entry After the candlestick pattern is confirmed, a trade signal is generated.
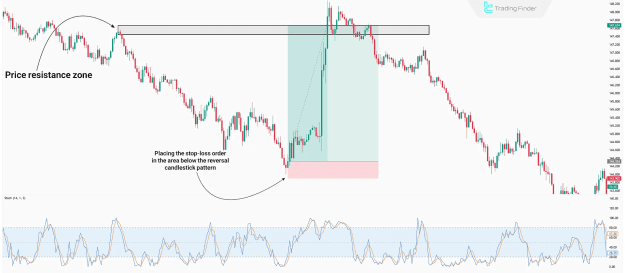
- Stop-loss orders should be placed just above a reversal candlestick for a sell trade or below it for a buy trade.
- Take-profit levels are typically set at the next key support or resistance area.
Combining the Stochastic Oscillator with Other Technical Indicators
Combining the stochastic oscillator with other technical tools can significantly improve trading analysis and signal confirmation.
- Stochastic Indicator + Moving Average (MA): A long-period moving average can serve as dynamic support or resistance. A bullish stochastic signal becomes more reliable when the price is positioned above the MA.
- Stochastic Indicator + Relative Strength Index (RSI): The RSI can provide faster confirmation. For example, if a divergence appears on the stochastic but the lines haven't reached an extreme zone, a simultaneous overbought or oversold reading on the RSI can validate the signal.
- Stochastic Indicator + MACD: Divergences that appear on both the stochastic oscillator and the MACD histogram can effectively filter out false signals. A divergence on the stochastic that is not confirmed by the MACD histogram should be treated with caution.
Conclusion
The stochastic oscillator is a powerful momentum indicator that compares a security's closing price to its recent price range. Comprised of the %K and %D lines, it identifies overbought and oversold conditions by oscillating between 0 and 100. When combined with other technical indicators like the RSI, MACD, or moving averages, or with candlestick patterns, its signals become more reliable, thereby increasing the success rate of trading strategies.