Prop Firm DrawDown Protector : Prop Firm Capital Protection Expert MT4 |Forex Money Management: Forex Trade Management Expert MT4 |ICT Concepts Indicator MT4 | Smart Money Concepts Expert MT4| Get a free Expert Advisor license via Telegram and WhatsApp
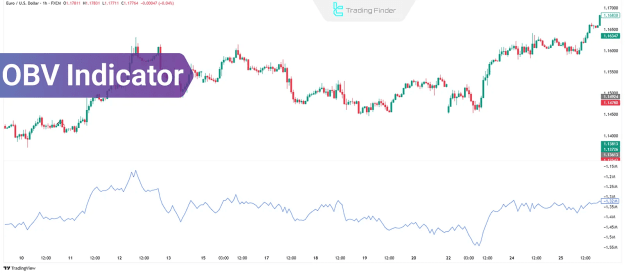
Displayed as a continuous line beneath the main price chart, the OBV line has no fixed range. On platforms such as MT4, MT5, and TradingView, the OBV line rises or falls depending on volume additions or subtractions—providing traders with early insight into directional momentum.
Due to its sensitivity to volume, the OBV is frequently used for:
- Detecting divergence
- Confirming ongoing trends
- Analyzing the presence and activity of institutional investors
How the OBV Indicator Works
The OBV calculation is based on the closing price of candlesticks by default, but this can be modified to other price types on various platforms.
OBV Calculation Logic:
- If the current close is higher than the previous close → the volume is added to OBV
- If the current close is lower → the volume is subtracted
- If the close remains unchanged → the OBV value remains constant
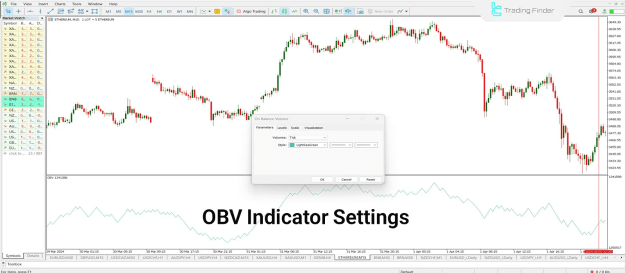
Key Configuration Sections in the OBV Settings:
- Parameters: Adjust price type, line color, thickness, and style
- Levels: Add horizontal lines to identify volume accumulation or reaction zones
- Visualization: Define the specific timeframes on which the indicator will be visible
Limitations of OBV in Forex
Unlike stock markets that offer real trading volume data, the Forex market relies on tick volume—the count of price changes over time. This makes OBV less accurate on lower timeframes in Forex trading. However, on higher timeframes such as H4 and daily, the OBV can still offer valuable liquidity insights due to data aggregation.
OBV Signals and How to Use Them
The OBV indicator generates multiple types of signals that traders can incorporate into their strategies. These include divergence, trend confirmation, level breaks, and volume surges.
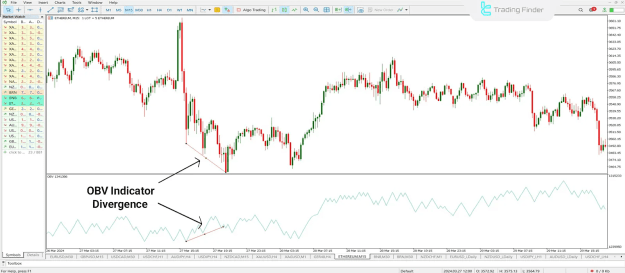
Divergence
Divergence occurs when the OBV line and price action move in opposite directions, signaling a potential reversal.
- Bullish Divergence: Price makes lower lows while OBV forms higher lows → Suggests institutional buying
- Bearish Divergence: Price makes new highs while OBV shows lower highs → Indicates potential trend reversal downward
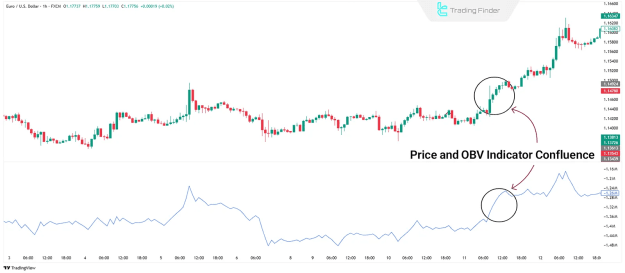
Trend Confirmation
When both price and OBV are aligned in the same direction, it confirms the strength of the prevailing trend.
- Rising price with rising OBV → Confirms bullish momentum
- Falling price with declining OBV → Confirms bearish continuation
Traders should still use complementary tools like price action analysis to identify weakening trends.
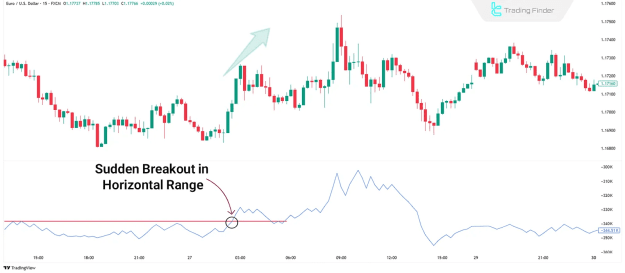
Level Breakouts
Prolonged horizontal movement in the OBV line followed by a breakout often indicates strong market participation from major players, potentially triggering a new trend.
- OBV breakout after consolidation → High probability of price movement soon after
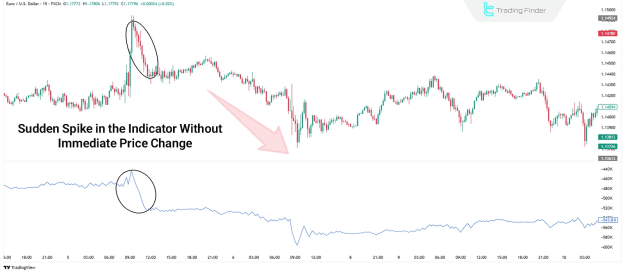
Abrupt Volume Surges
A sudden spike in OBV may signal the entry of institutional capital, even if price action has not yet responded.
- Unexpected OBV surge → Anticipate strong trend or reversal
- Volume spikes against the price trend → Stronger indication of trend exhaustion or shift
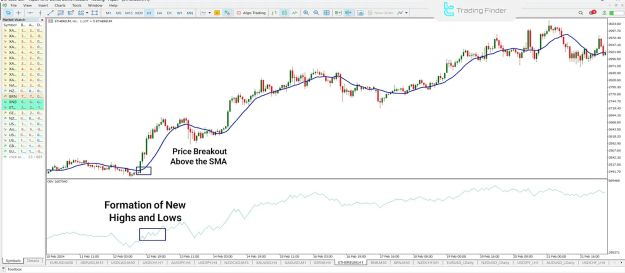
Trading Strategy: OBV and Simple Moving Average (SMA)
A widely used strategy pairs the OBV with the 14-period Simple Moving Average (SMA 14) to enhance trade signal reliability. This setup is ideal for traders seeking clear, rule-based entry points supported by volume confirmation.
Buy Signal
- Price crosses above the 14-period SMA
- OBV shows a rising pattern or prints new highs
- Interpretation: Buy-side volume entering, consider entering a long position
Sell Signal
- Price crosses below the 14-period SMA
- OBV is in a downtrend or making new lows
- Interpretation: Distribution phase beginning, consider shorting the asset
OBV Indicator: Pros and Cons
Advantages:
- Provides early signals before price reversals
- Simple to apply and interpret
- Useful in identifying trend strength and capital flow
- No need for advanced configuration
Disadvantages:
- Prone to false signals on lower timeframes due to tick volume
- Less effective in markets without real volume data
- Sensitive to short-term volatility
- Lacks adjustable parameters for fine-tuning
Final Thoughts
The OBV indicator serves as a powerful volume analysis tool for traders looking to evaluate liquidity, anticipate trend shifts, and confirm price action. While its effectiveness may be limited in Forex due to the absence of real volume, it remains a valuable component when used on higher timeframes or alongside other tools like moving averages and price action setups.
Combining OBV with additional indicators enhances trading precision and allows market participants to track institutional behavior and react proactively.