The Supply and Demand Curve is a visual representation that shows whether price is in the upper, middle, or lower region between two key zones. This framework enhances trade accuracy by aligning entries with the prevailing market context.
Prop Firm DrawDown Protector : Prop Firm Capital Protection Expert MT4 |Forex Money Management: Forex Trade Management Expert MT4 |ICT Concepts Indicator MT4 | Smart Money Concepts Expert MT4| Get a free Expert Advisor license via Telegram and WhatsApp
What Is Supply and Demand?
Supply and demand are the foundational principles driving price action in any market:
- Demand: Indicates buyer interest at a particular price level.
- Supply: Reflects seller willingness at the same price level.
When demand surpasses supply, prices increase. Conversely, when supply exceeds demand, prices decrease. This fundamental relationship is central to market behavior and critical for all traders.
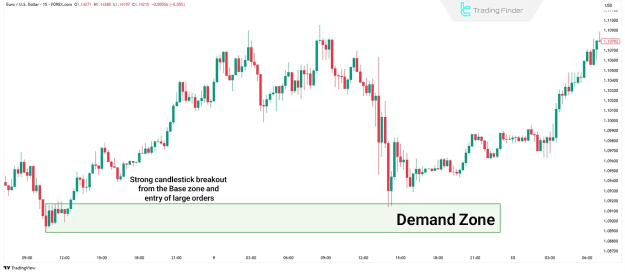
How to Identify Supply and Demand Zones
Key characteristics of supply and demand zones include:
- Zones typically appear after consolidation phases.
- They are marked by sharp price movements and high volume.
Steps to Identify:
- Locate the Base: The area where price paused briefly before a strong breakout.
- Analyze candlestick patterns to define zone boundaries.
- Look for imbalances suggesting significant buy or sell orders.
These zones often serve as future points of interest, where price may react upon revisit.
Supply and Demand vs. Support and Resistance
While both concepts involve key price levels, their foundations differ:
- Support and Resistance: Derived from historical price behavior, usually drawn as lines.
- Supply and Demand: Highlight actual imbalances where institutional orders influenced price, represented with measurable depth.
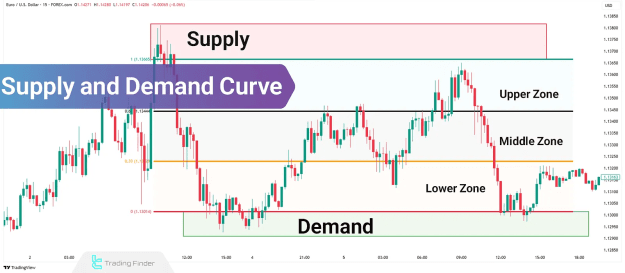
What Is the Supply and Demand Curve?
The Supply and Demand Curve helps determine the price's relative position within the range between major supply and demand zones:
- Upper Segment: Near supply
- Middle Segment: Neutral/equilibrium
- Lower Segment: Near demand
This positional awareness helps traders avoid poor trade entries, such as buying near supply or selling near demand.
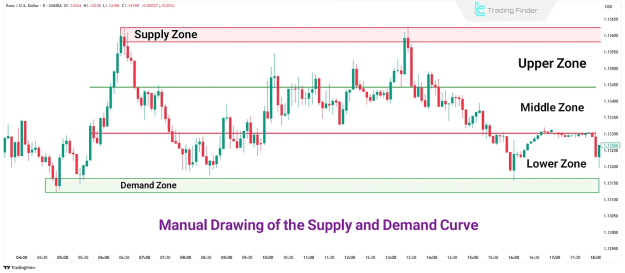
How to Plot the Supply and Demand Curve on a Chart
Method 1: Manual Plotting
- Mark proximal lines of both supply and demand zones.
- Measure the range between these two points.
- Divide the range into three equal parts:
- Upper third: Supply proximity
- Middle third: Equilibrium zone
- Lower third: Demand proximity
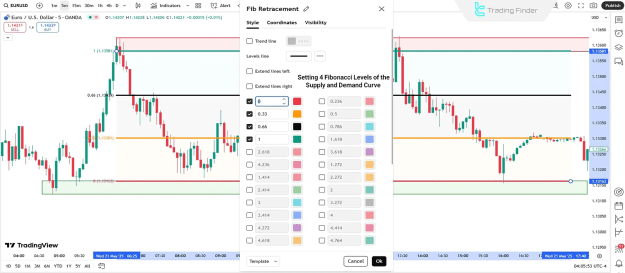
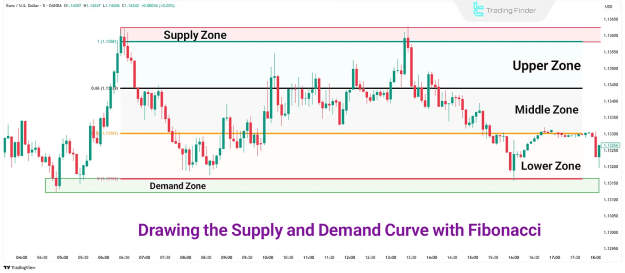
Method 2: Using Fibonacci Tool
To improve accuracy and efficiency, use Fibonacci retracement:
- Enable only: 0%, 33%, 66%, 100%
- Disable all other levels
- Apply the tool from the supply zone's proximal line to the demand zone's proximal line
The resulting divisions:
- 0%–33%: Near supply (if downtrend)
- 33%–66%: Equilibrium zone
- 66%–100%: Near demand (if downtrend)
Multi-Timeframe Analysis of the Supply and Demand Curve
Multi-timeframe analysis increases trade reliability:
- Higher Timeframe (e.g., Daily): Identify primary trend and major zones
- Mid Timeframe (e.g., 1H): Spot internal supply/demand structures
- Lower Timeframe (e.g., 15min): Confirm precise entries
This structured approach aligns with the dominant trend and minimizes risk.
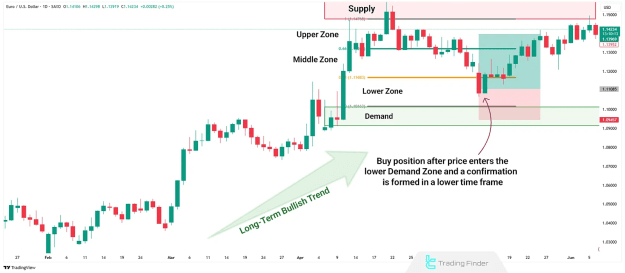
Bullish Supply and Demand Curve Trading Setup
- Scenario: In a bullish EUR/USD daily trend, price enters the lower curve zone
- Signal: Confirmation on a lower timeframe suggests a long opportunity
- Confluence: When lower timeframe demand aligns with a higher timeframe zone, trade probability improves
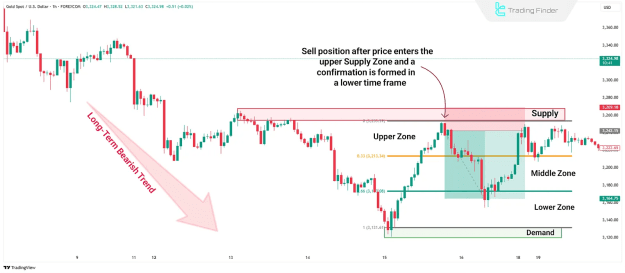
Bearish Supply and Demand Curve Trading Setup
- Scenario: On a 1H chart of XAU/USD, price enters the upper curve zone after a pullback
- Signal: Weak buyer activity and emerging lower timeframe sell pressure justify a short trade
- Confluence: Enhanced when the zone aligns with a higher timeframe downtrend
Conclusion
Analyzing supply and demand is significantly improved when combined with the Supply and Demand Curve methodology. By understanding price’s exact location within this curve, traders can:
- Avoid low-probability trades
- Align entries with trend direction
- Use manual or Fibonacci plotting for clear segmentation
- Employ multi-timeframe analysis to improve precision
When internal zones align with higher timeframe structures, the potential for successful, low-risk trades increases substantially.