Prop Firm DrawDown Protector : Prop Firm Capital Protection Expert MT4 |Forex Money Management: Forex Trade Management Expert MT4 |ICT Concepts Indicator MT4 | Smart Money Concepts Expert MT4| Get a free Expert Advisor license via Telegram and WhatsApp
By using the ADX, traders can avoid entering low-momentum trades and focus on setups aligned with stronger, more reliable trends.
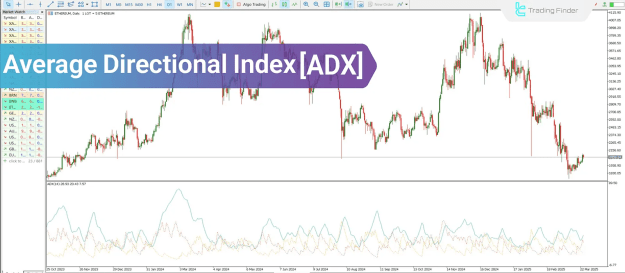
What Is the ADX Indicator?
The ADX, or Average Directional Index, is designed to measure the strength of a trend without considering its direction. It helps traders assess whether price action is trending or consolidating.
This makes the ADX especially valuable when selecting appropriate market conditions for trend-following strategies and confirming entries during trend continuation.
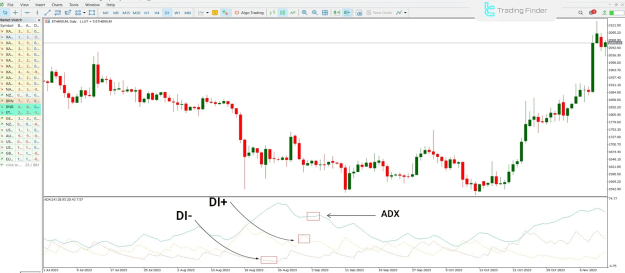
Components of the ADX Indicator
The ADX system includes three core elements:
- +DI (Positive Directional Indicator): Measures upward price movement.
- –DI (Negative Directional Indicator): Measures downward price movement.
- ADX Line: Measures the strength of the prevailing trend.
These components work together to provide insight into the market’s directional strength. The ADX value is calculated by analyzing the relationship between +DI and –DI and smoothing the results over a specific period (commonly 14 periods) using a moving average.
How the ADX Is Calculated
Step 1: Directional Movement (DM)
- If (Today’s High – Yesterday’s High) > (Yesterday’s Low – Today’s Low) → record as positive DM
- If (Yesterday’s Low – Today’s Low) > (Today’s High – Yesterday’s High) → record as negative DM
- If neither condition is met, both values are considered zero.
Step 2: Calculate +DI and –DI
- Divide the positive and negative DM values by the Average True Range (ATR).
- Smooth the values over a chosen period to generate +DI and –DI lines.
Step 3: Determine the Directional Index (DX)
- Use the +DI and –DI values to compute the DX, which represents the degree of directional strength.
Step 4: Calculate the ADX
- Apply an exponential moving average (EMA) to the DX values over a set number of periods to generate the ADX line.
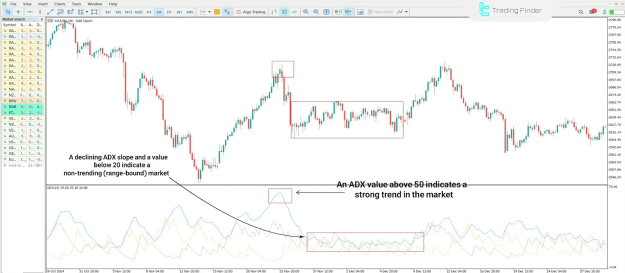
Understanding ADX Values
The ADX line ranges from 0 to 100, providing insight into the strength—but not the direction—of a trend:
- Below 20: Indicates a weak or sideways market.
- Above 25: Suggests the beginning of a trend.
- Above 50: Confirms a strong, established trend.
The ADX is most effective when used to confirm whether the market is worth trading, rather than indicating when to enter or exit trades.
Trend Strength in Practice: ADX on XAUUSD
Consider a 4-hour chart of XAUUSD (Gold vs. USD):
- An ADX value above 50 accompanied by an upward slope signals a strong trend.
- A declining ADX, especially dropping below 20, often suggests weakening momentum and a transition to range-bound behavior.
Using ADX in Conjunction with Other Indicators
To increase accuracy, the ADX is best used alongside indicators that measure trend direction or price momentum.
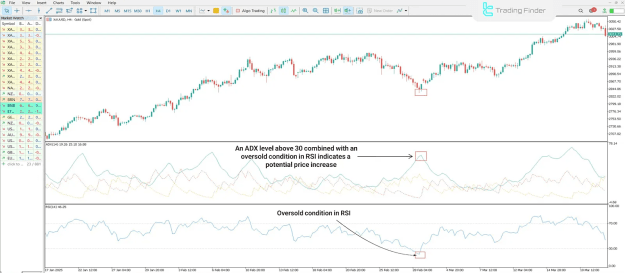
ADX + RSI (Relative Strength Index)
- RSI helps identify overbought or oversold conditions.
- When ADX > 25–30 and RSI rises from oversold, it may confirm a bullish trend.
- A drop from RSI’s overbought zone in a strong ADX environment may suggest a bearish reversal.
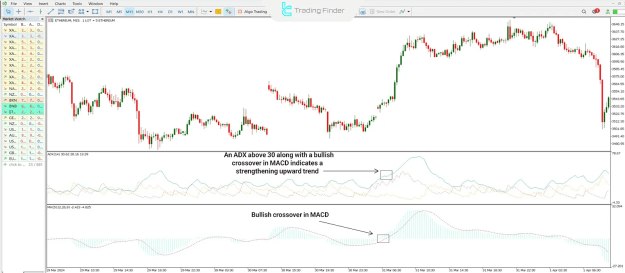
ADX + MACD (Moving Average Convergence Divergence)
- MACD reveals trend direction and momentum shifts.
- A bullish MACD crossover when ADX is high signals a potential uptrend continuation.
- A bearish MACD crossover with a rising ADX confirms strong downward momentum.
Common Mistakes When Using ADX
Traders often misuse the ADX, leading to misinformed decisions. Key mistakes include:
- Using ADX as a Trade Signal on Its Own
ADX shows trend strength, not trade direction. It should be paired with indicators or price patterns. - Ignoring the Slope of the ADX Line
A rising ADX reflects strengthening momentum—even if it’s under 25. A falling ADX may indicate fading momentum even if the value is above 40. - Applying ADX in Low-Volatility Sessions
During inactive markets, ADX readings can be unreliable. Wait for stronger volume or confirmation from other tools. - Misunderstanding Timeframes
An ADX reading on a daily chart carries more weight than one on an hourly chart. Always assess ADX values within the context of your chosen timeframe. - Disregarding Price Action or Support/Resistance Levels
ADX is more effective when combined with price structure, trendlines, candlestick signals, or breakouts.
Final Thoughts
The ADX Indicator is a critical tool for identifying whether a market is trending or ranging. While it doesn’t indicate direction, it offers significant insight into trend strength, helping traders decide whether to stay in a trade, wait for a better setup, or stand aside entirely.
To use ADX effectively:
- Focus on the value and slope of the ADX line.
- Combine it with directional indicators such as RSI, MACD, or price action tools.
- Adapt your interpretation based on the timeframe and market conditions.
When used properly, the ADX serves as a valuable filter—eliminating weak setups and increasing the likelihood of trading within strong, sustainable trends.