Deep Crab Harmonic Pattern Indicators:
Deep Crab Harmonic Pattern Indicator MT4
Deep Crab Harmonic Pattern Indicator MT5
Prop Firm DrawDown Protector : Prop Firm Capital Protection Expert MT4 |Forex Money Management: Forex Trade Management Expert MT4 |ICT Concepts Indicator MT4 | Smart Money Concepts Expert MT4| Get a free Expert Advisor license via Telegram and WhatsApp
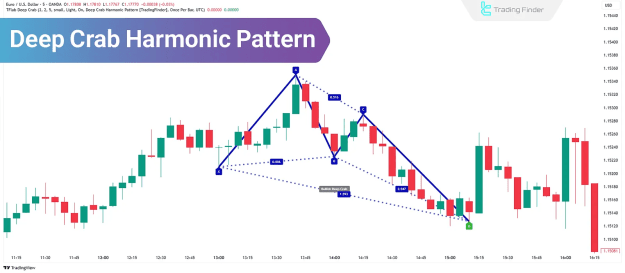
What Is the Deep Crab Pattern?
The Deep Crab Pattern is a harmonic reversal structure in technical analysis that shares similarities with the standard Crab Pattern. Its primary distinction lies in the depth of point B's retracement relative to the XA leg.
- In the Deep Crab pattern, point B retraces 88.6% of the XA leg.
- In contrast, the standard Crab pattern allows for a B point retracement between 38.2% and 61.8%.
This pattern commonly emerges at the conclusion of strong trends and offers high-probability trade setups when combined with confirmation tools.
Note: While Fibonacci precision is crucial, slight flexibility near key levels is recommended to avoid missing viable setups.
Advantages and Disadvantages of the Deep Crab Pattern
Like all harmonic patterns, the Deep Crab offers both strategic benefits and technical challenges. Its effectiveness depends largely on the trader’s skill and the confirmation methods employed.
Pros:
- Clearly defines entry and exit points
- Utilizes Fibonacci levels for structured confirmation
- Applicable across multiple asset classes and timeframes
Cons:
- Requires technical proficiency to identify accurately
- Often needs supporting indicators for confirmation
- Prone to misinterpretation or incorrect pattern labeling
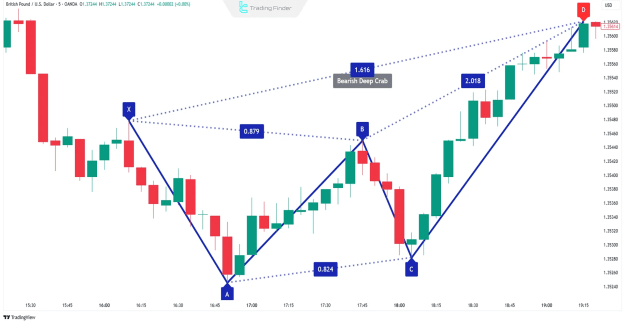
How to Identify the Deep Crab Pattern
The Deep Crab structure consists of five points: X, A, B, C, and D. It adheres to a strict set of Fibonacci-based conditions:
- Point B retraces 88.6% of the XA leg
- BC leg extends between 2.24 and 3.618 times the length of AB
- CD leg typically equals 1.618 of XA, or ranges from 2.24 to 3.618 of BC
Accurate identification of this structure requires precise measurement tools. Traders can streamline this process by using automated harmonic pattern indicators.
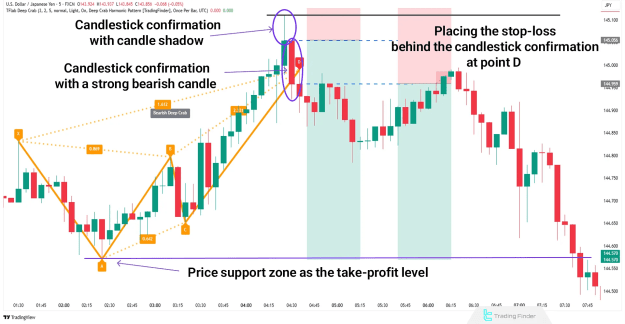
How to Trade the Deep Crab Pattern
Once the pattern is validated, and the structure is correctly drawn from X to D, trading execution involves the following steps:
- Mark points X, A, B, C, and D
- Identify point D as the Potential Reversal Zone (PRZ)
- Wait for candlestick confirmation near point D before entering a trade
- Place stop-loss just beyond point D
- Set take-profit levels at Fibonacci retracement zones or major support/resistance areas
Conclusion
The Deep Crab Harmonic Pattern is a highly effective yet rarely occurring structure. Manual identification based on strict Fibonacci criteria can be time-consuming and prone to error. For improved accuracy and efficiency, the use of automated pattern recognition tools is highly recommended.
This pattern, when correctly applied, can serve as a valuable asset in a trader’s technical strategy—offering well-defined reversal zones and strong risk-to-reward setups across various markets.