Prop Firm DrawDown Protector : Prop Firm Capital Protection Expert MT4 |Forex Money Management: Forex Trade Management Expert MT4 |ICT Concepts Indicator MT4 | Smart Money Concepts Expert MT4| Get a free Expert Advisor license via Telegram and WhatsApp
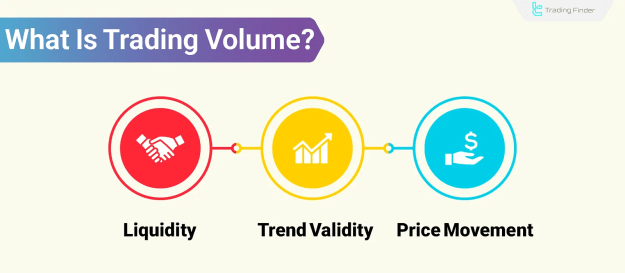
What Is Trading Volume?
Trading volume represents the total number of buy and sell transactions for a specific asset or across the entire market within a given timeframe—whether daily, weekly, or monthly.
Key Functions of Trading Volume:
- Measures the strength of price movements
- Evaluates market interest in an asset
- Identifies liquidity conditions
Volume vs. Turnover
While both metrics assess market activity, they serve different purposes. Volume refers to the number of units traded (e.g., shares or crypto tokens), whereas Turnover represents the total monetary value exchanged (calculated as Volume × Price per unit).
For example, if 10,000 shares of a stock trade at $50 each:
- Volume = 10,000 shares
- Turnover = $500,000
The Role of Volume in Tracking Smart Money
Institutional players—such as hedge funds, banks, and whales—leave footprints in volume data. Despite efforts to conceal their activity, volume analysis helps detect accumulation phases (large buyers entering), distribution phases (large sellers exiting), and false breakouts.
Types of Trading Volume
Different volume metrics provide unique insights into market behavior:
1. Daily Volume
Total transactions recorded in a single trading day, commonly used in technical analysis.
2. Intraday Volume
Tracks volume in short timeframes (e.g., 5 or 15 minutes), useful for scalping and day trading.
3. Cumulative Volume
The sum of volume over a defined period, helping identify long-term liquidity trends.
4. Relative Volume
Compares current volume to historical averages, with values above 1 indicating unusually high activity.
5. Volume by Price
Displays trading activity at specific price levels, revealing hidden support/resistance zones.
6. Effective (Real) Volume
Distinguishes between buying and selling pressure, often tied to Level 2 market data.
Volume Analysis Across Different Markets
Stock Market
High volume confirms institutional participation, especially near resistance zones.
Forex Market
Uses tick volume (price changes) due to its decentralized nature.
Cryptocurrency Market
High volume correlates with volatility, with data sourced from exchanges and blockchain networks.
Commodities Market
Volume combined with open interest reveals trend strength and liquidity flow.
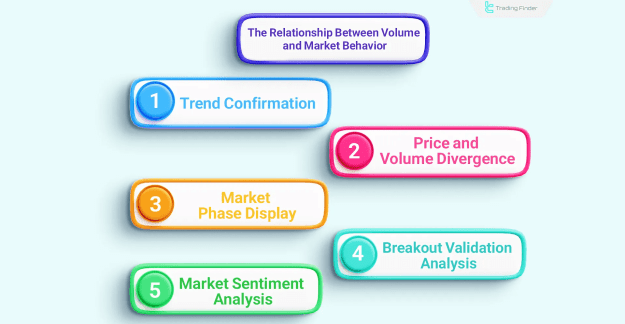
Volume-Price Relationship
Volume is one of the few market variables resistant to manipulation, making it a reliable tool for traders.
Key Principles:
- Trend Confirmation – Rising volume validates price movement
- Divergence Warning – Price highs/lows with weak volume signal reversals
- Breakout Validation – Legitimate breakouts require high volume
- Market Sentiment – Volume spikes reflect fear/greed extremes
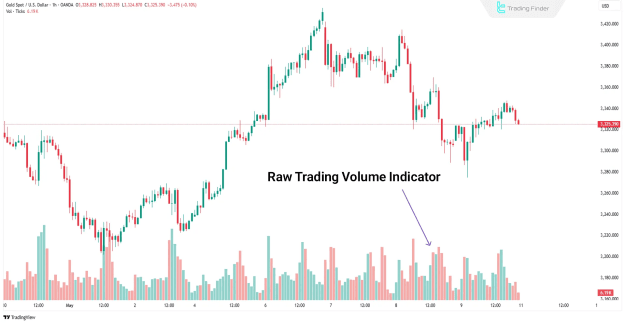
Essential Volume-Based Indicators
1. Raw Volume Indicator
Displays total transactions per candlestick, used for breakout validation and trend strength assessment.
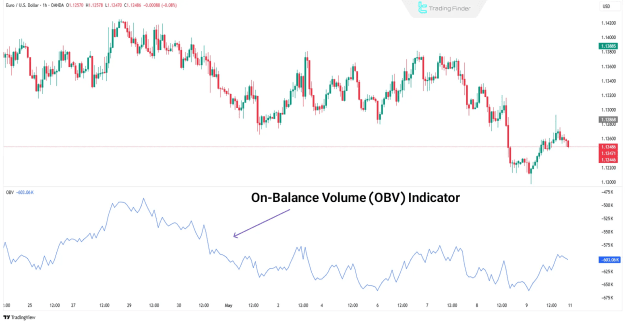
2. On-Balance Volume (OBV)
Tracks cumulative volume in the direction of price, detecting smart money flow and divergences.
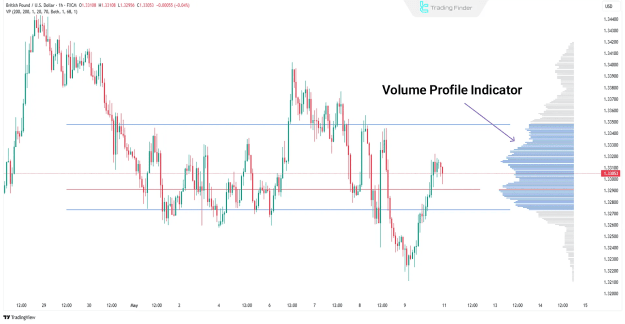
3. Volume Profile
Shows trading activity at price levels, identifying high-liquidity zones.
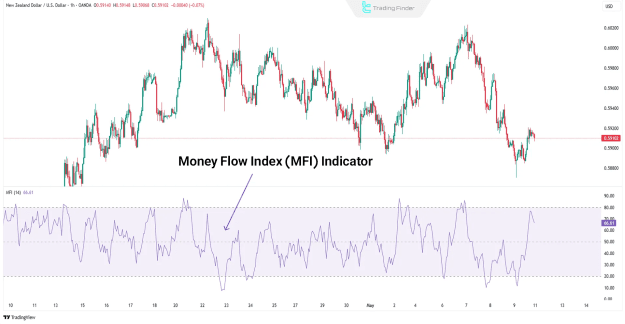
4. Money Flow Index (MFI)
A volume-weighted RSI (range: 0-100) used to spot overbought/oversold conditions.
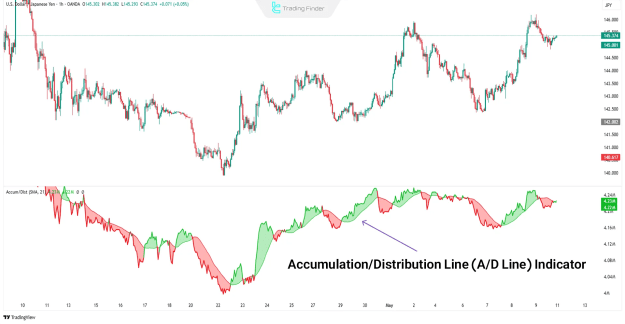
5. Accumulation/Distribution Line
Weights volume by closing price position, helping identify market phases.
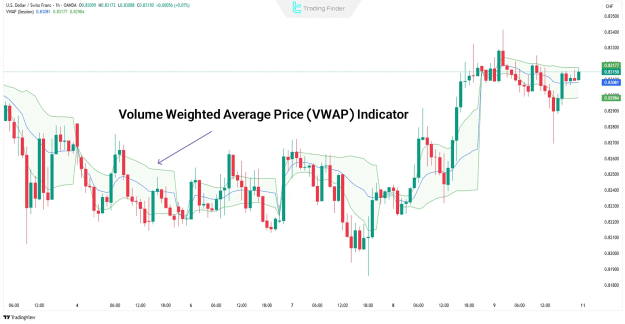
6. VWAP (Volume-Weighted Avg. Price)
Calculates the average price weighted by volume, serving as an institutional benchmark for fair value.
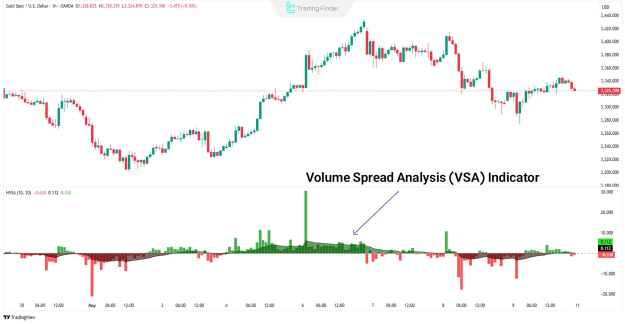
7. Volume Spread Analysis (VSA)
Analyzes volume, candle spread, and closing position to detect smart money manipulation.
Common Volume Analysis Mistakes
- Misinterpreting High Volume – Can indicate distribution, not just strength
- Ignoring Market Context – Volume must align with price action
- Overlooking Relative Volume – Compare current volume to historical averages
- False Breakout Assumptions – Low-volume breakouts often fail
Conclusion
Trading volume is a cornerstone of market analysis, offering insights into liquidity, trend strength, and institutional activity. By combining volume with price action and technical indicators, traders gain a deeper understanding of market dynamics.
Key Takeaways:
- Volume confirms trends & breakouts
- Divergences warn of reversals
- Smart money leaves volume footprints
- Always analyze volume in context
Mastering volume analysis enhances trading precision, helping traders navigate financial markets with confidence.