TP & SL Tool: Risk Reward Ratio Calculator RRR MT4 | Prop Firm Protector: Trade Assist Prop Firm Plus TF Expert MT4 | Money Management + DrawDown Protector: Trade Panel Prop Firm Drawdawn Limiter Pro MT4 |Get a free Expert Advisor license via Telegram and WhatsApp
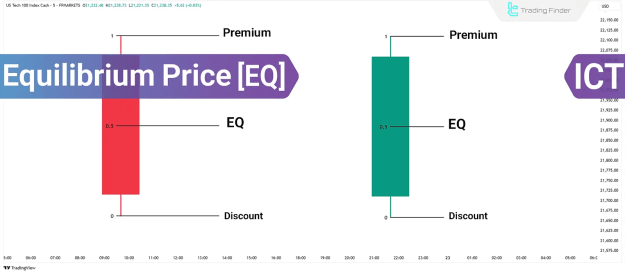
What Is Price Equilibrium (EQ)?
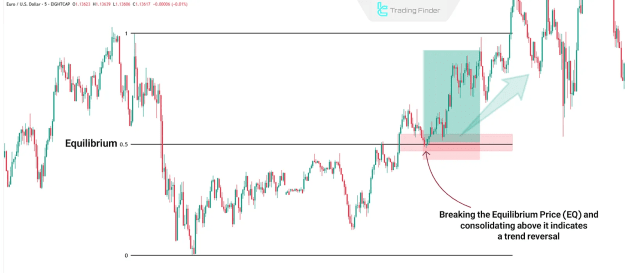
EQ is calculated as the 0.5 Fibonacci retracement level between the wick high and wick low of a candle. This midpoint helps traders assess potential price direction:
- Holding EQ: If price reacts positively to EQ and stays above it, the prevailing trend is likely to continue.
- Breaking EQ: A confirmed break below EQ suggests a potential reversal or trend weakness.
EQ gains further significance when combined with other ICT concepts like Fair Value Gaps (FVG) and Order Blocks (OB), helping traders identify high-probability entry and exit zones.
How to Use EQ in Daily Market Analysis
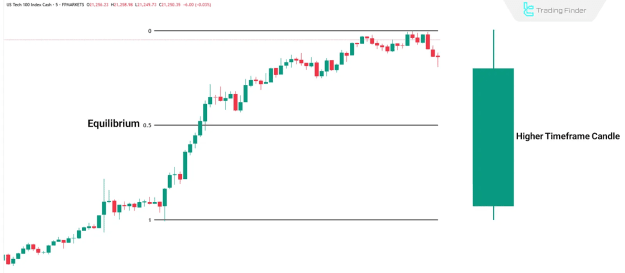
1. Analyzing the Previous Day’s Candle
Begin by measuring the full range of the prior candle (wick high to wick low). The 0.5 Fibonacci level marks the EQ.
- Bullish Confirmation: If price holds above EQ, expect trend continuation.
- Bearish Rejection: A break and close below EQ suggests a possible trend reversal.
2. Identifying EQ and PD Arrays in Key Zones
Once EQ is established, traders should look for Premium/Discount (PD) Arrays in the active zone, such as:
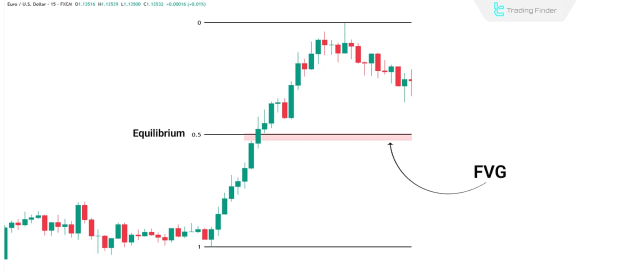
- Fair Value Gaps (FVG)
- Order Blocks (OB)
- Opposing Candles
- Protected Highs/Lows
These elements enhance the probability of a favorable price reaction. For example, a bullish FVG above EQ acts as a support zone for potential long entries.
3. Confirming a Change in Delivery State
A valid trade setup requires more than just EQ and PD Arrays—price must show a clear shift in behavior, confirmed by:
- Closing above a significant bearish candle
- Breaking a key candle in the intended direction
- Rejecting from an FVG
This shift indicates market readiness to resume the trend, justifying trade execution.
Practical Examples of EQ in Trading
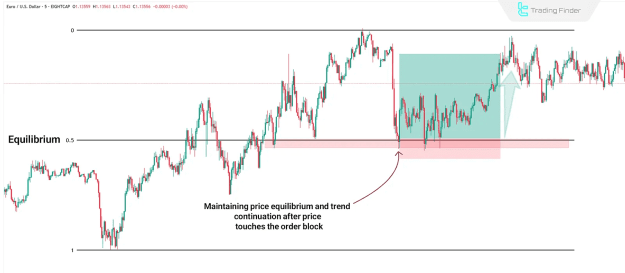
Case 1: Holding EQ and Trend Continuation
When price respects EQ and stays above it, traders can anticipate trend continuation. Confirmation comes from:
- Price closing above an FVG or OB
- Strong bullish/bearish momentum in the active half
Trade Execution:
- Enter in the direction of EQ hold
- Place stop-loss beyond the nearest support/resistance
Case 2: Breaking EQ and Trend Reversal
If price breaks and closes below EQ, it signals a potential phase change (e.g., expansion to retracement). Traders should:
- Shift bias accordingly
- Look for setups in the opposite direction
- Monitor liquidity zones for confirmation
Multi-Timeframe EQ Analysis for Higher Accuracy
EQ is a fractal concept, applicable across all timeframes:
- Daily EQ: Defines overall market bias
- 4H EQ: Assesses mid-term structure
- 1H EQ: Refines entry timing
Pro Tip: Aligning EQ levels across multiple timeframes increases setup reliability. For example, if daily and 4H EQ coincide, traders can use 1H price action for precise entries.
Common Mistakes When Using EQ
1. Expecting Full Retracement in Expansion Phases
During expansions, price rarely returns to premium/discount zones. Assuming a full retracement leads to premature entries—focus instead on the active half of the range.
2. Using Candle Body Instead of Wicks
EQ must be calculated from wick extremes, not the candle body. Using the body distorts EQ levels and skews analysis.
Conclusion
Price Equilibrium (EQ) is a powerful tool in ICT trading, helping traders gauge market reactions and anticipate trend movements. Its true strength emerges when combined with:
- Liquidity zones
- Order flow confirmation
- Multi-timeframe alignment
By correctly applying EQ, traders enhance their ability to identify high-probability setups and improve decision-making in dynamic market conditions.