Unlike lagging indicators, the Pivot Point Indicator is based on real-time calculations using historical price data, making it particularly effective for short-term trading in volatile markets. Because of its objective, numerical nature, the indicator is widely favored for intraday and algorithmic strategies.
TP & SL Tool: Risk Reward Ratio Calculator RRR MT5 | Prop Firm Protector: Trade Assist Prop Firm Plus TF Expert MT5 | Money Management + DrawDown Protector: Trade Panel Prop Firm Drawdawn Limiter Pro MT5 |Get a free Expert Advisor license via Telegram and WhatsApp
Importance of Pivot Levels
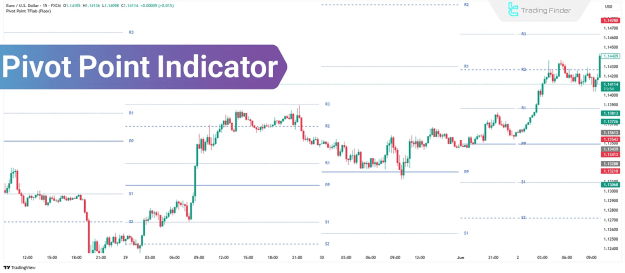
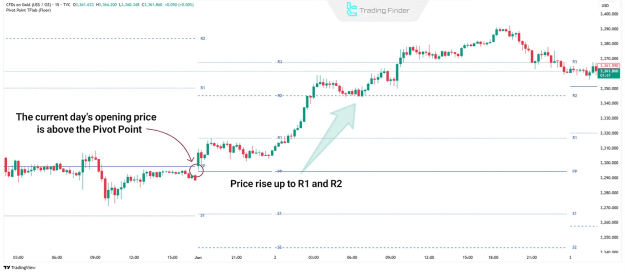
Pivot Points are frequently monitored by traders due to their tendency to act as psychological levels in the market. When the price opens above the central Pivot Point, it often indicates a bullish sentiment; if it opens below, a bearish bias may prevail.
Day traders often utilize Pivot Points to:
- Identify precise entry and exit levels
- Set stop-loss and take-profit zones
- Analyze intraday trend direction
- Confirm breakouts or potential reversals
The Four Main Methods of Pivot Point Calculation
Floor Method
The Floor or Standard method is the most widely used and simplest calculation model. It is derived from the average of the previous day’s high, low, and close prices.
Key Applications:
- Price opening above the Pivot Point (PP) suggests a move toward resistance levels (R1, R2)
- Price opening below PP indicates potential movement toward support levels (S1, S2)
- Effective for planning short-term entries, exits, and stop-loss placements
Camarilla Method
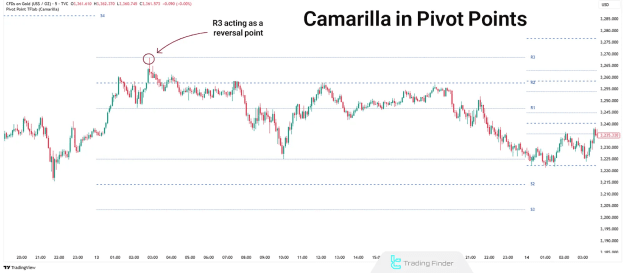
The Camarilla model enhances traditional Pivot Points by calculating eight distinct support and resistance levels. This method emphasizes minor price fluctuations, which is highly advantageous in short-term or scalping strategies.
Key Applications:
- Ideal for fast-paced markets with frequent reversals
- R3 and S3 are typically used as reversal zones
- R4 and S4 signal potential breakout scenarios
- Enhances accuracy in defining tight stop-loss and take-profit levels
Woodie Method
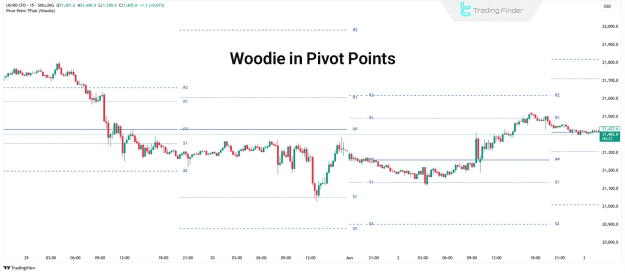
The Woodie model differs from the standard method by assigning greater weight to the previous day's closing price. This adjustment makes it more responsive to sessions that end with strong momentum or gaps.
Key Applications:
- Suitable for markets prone to gap openings (e.g., futures, indices)
- Offers better alignment with directional bias from the previous session
- Useful in identifying support/resistance with a momentum-focused perspective
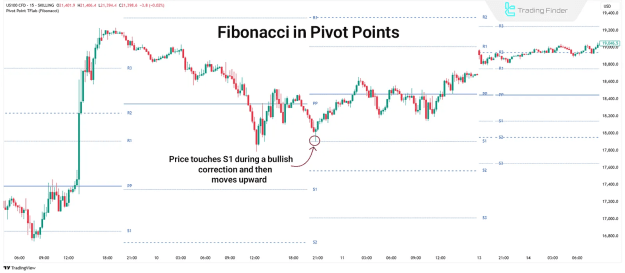
Fibonacci Method
The Fibonacci Pivot Point combines the conventional high-low-close calculation with Fibonacci retracement ratios. It is primarily used for identifying potential reversal zones based on natural retracement behavior.
Key Applications:
- Suitable for swing trading strategies
- Allows traders to identify high-probability entries during pullbacks
- S1 and S2 can act as buying zones in an uptrend
- R1 and R2 often serve as upside profit targets
Components and Settings of the Pivot Point Indicator
The Pivot Point Indicator typically includes the following levels:
- PP (Pivot Point) – The central level, serving as the main reference point
- Support Levels – S1, S2, S3 (additional levels in advanced models like Camarilla)
- Resistance Levels – R1, R2, R3 (extended in some methods to R4)
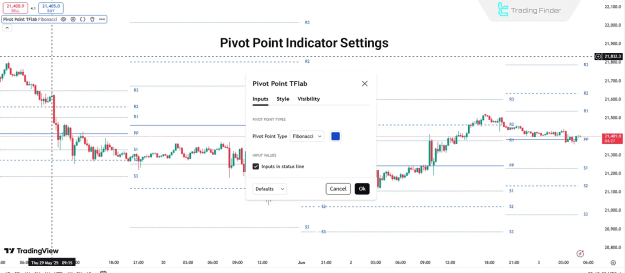
Customization Options:
- Selection of calculation method: Floor, Camarilla, Woodie, or Fibonacci
- Enable “Inputs in status line” to display key level values (e.g., PP, R1, S1) on the chart interface
- Compatible with platforms such as MetaTrader 4, MetaTrader 5, and TradingView
Trading Strategies Using Pivot Points
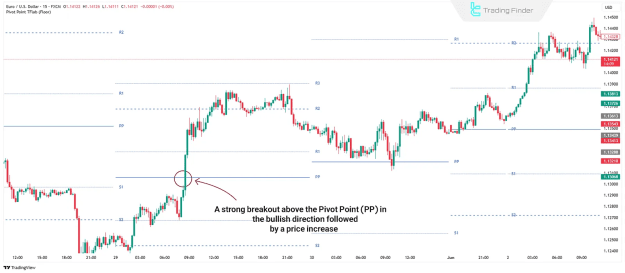
Breakout Strategy
This strategy involves trading in the direction of a strong price movement when it breaks through a key pivot level (PP, R1, S1, etc.).
Use Cases:
- Identifying the beginning of a new trend
- Capitalizing on high-volume breakouts
- Entering trades after confirming a decisive level break
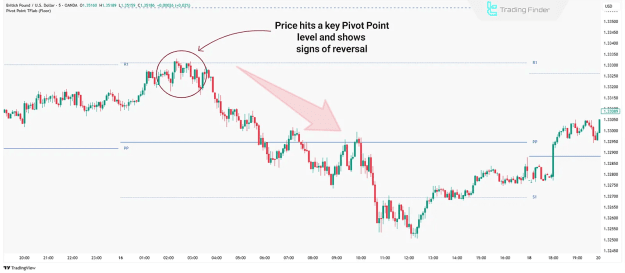
Price Reversal Strategy
In this method, traders wait for the price to reach a major pivot level and then look for reversal signals, aiming to enter in the opposite direction.
Use Cases:
- Trading counter-trend moves
- Utilizing support and resistance for low-risk entries
- Confirming price rejection with candlestick or momentum patterns
Conclusion
The Pivot Point Indicator is a mathematically grounded tool designed to identify critical price levels where market reactions are more likely. With multiple calculation methods—Floor, Camarilla, Woodie, and Fibonacci—traders can select the one most suited to their strategy and market conditions.
By integrating Pivot Points with other technical indicators or price action analysis, traders can increase their precision in identifying trade opportunities, while also improving risk management and reducing error margins in volatile environments.