TP & SL Tool: Risk Reward Ratio Calculator RRR MT4 | Prop Firm Protector: Trade Assist Prop Firm Plus TF Expert MT4 | Money Management + DrawDown Protector: Trade Panel Prop Firm Drawdawn Limiter Pro MT4 |Get a free Expert Advisor license via Telegram and WhatsApp
What Is a Trend Reversal?
A trend reversal occurs when the prevailing market direction shifts. For example:
- An uptrend (rising prices) reverses into a downtrend (falling prices).
- A downtrend reverses into an uptrend.
Reversals can appear across all timeframes, from intraday charts to long-term weekly or monthly trends.
Key Signs of a Potential Reversal
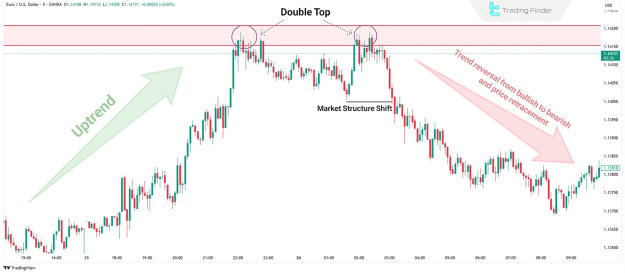
- Market Structure Shift (MSS):
- In an uptrend, failure to make a new high followed by a break below the previous low signals weakness.
- In a downtrend, failure to make a new low followed by a break above the previous high suggests a bullish reversal.
- Loss of Momentum:
- Slowing price movement and weakening candlestick patterns indicate trend exhaustion.
- Reversal Patterns:
- Classic patterns like double tops/bottoms, head and shoulders, or reversal candlesticks (pin bars, engulfing patterns) often form at turning points.
- Indicator Divergence:
- When price makes a new high/low, but indicators like RSI or MACD fail to confirm, it signals weakening momentum.
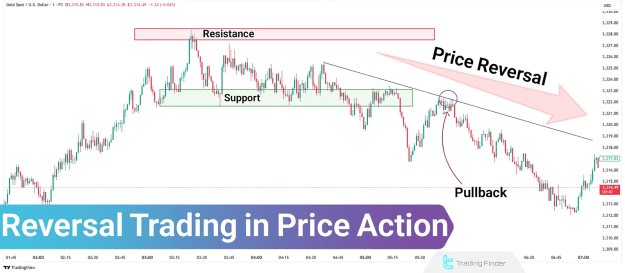
Reversal vs. Pullback: Critical Differences
Many traders confuse reversals with pullbacks. Here’s how to distinguish them:
- Pullback: A temporary retracement before the trend resumes.
- Reversal: A complete trend change leading to a new directional move.
Pullbacks are short-term, while reversals establish medium to long-term trend changes.
Key Reference Points for Reversal Trading
Professional traders rely on critical zones where reversals are more likely:
- Support & Resistance Levels
- Trendlines & Channels
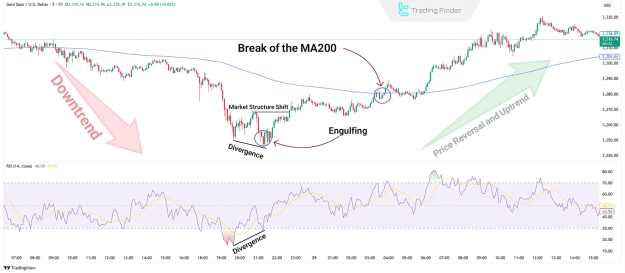
- Moving Averages (e.g., MA-200)
- Supply & Demand Zones
3 Reliable Methods to Spot Trend Reversals
1. Market Structure Shift (MSS)
A healthy uptrend forms higher highs (HH) and higher lows (HL). If price fails to make a new HH and breaks the previous HL, it signals a potential reversal.
2. Higher Timeframe Confirmation
Reversal signals on lower timeframes (e.g., 5M, 15M) can be false. Always validate with higher timeframes (1H, 4H, Daily) for stronger confirmation.
3. Break of the 200 Moving Average (MA-200)
The MA-200 acts as a major trend filter:
- Break below MA-200 suggests a bearish reversal.
- Break above MA-200 indicates a bullish reversal.
Avoiding Fake Reversals: Pro Trader Tips
False reversals often trap traders. To avoid them:
- Multi-Timeframe Analysis – Confirm signals on higher timeframes.
- Context Matters – Reversals near key zones (support/resistance) are more reliable than mid-range moves.
- Strong Candlestick Confirmation – Look for high-volume reversal candles (engulfing, pin bars) instead of weak indecision candles.
Real-World Reversal Trading Examples
Example 1: Bearish Reversal (Short Trade)
On EUR/USD, if price fails to make a new high and breaks the previous low, it signals a potential downtrend.
- Entry: Wait for confirmation (e.g., bearish engulfing in a supply zone).
- Stop Loss: Above the recent swing high.
- Target: Previous support levels or based on risk-reward ratio.
Example 2: Bullish Reversal (Long Trade)
After a sharp gold (XAU/USD) decline, watch for:
- Bullish divergence (RSI/MACD)
- Reversal candles (hammer, engulfing) near support
- Higher low formation confirming trend shift
Final Thoughts: Trading Reversals Successfully
Reversal trading offers high-reward opportunities but requires precision. Always look for:
- Market Structure Shift (MSS)
- Higher Timeframe Confirmation
- Strong Candlestick & Indicator Signals
Without clear evidence, entering reversals is highly risky. Master these techniques to improve your trading accuracy and profitability.