TP & SL Tool: Risk Reward Ratio Calculator RRR MT5 | Prop Firm Protector: Trade Assist Prop Firm Plus TF Expert MT5 | Money Management + DrawDown Protector: Trade Panel Prop Firm Drawdawn Limiter Pro MT5 |Get a free Expert Advisor license via Telegram and WhatsApp
Fibonacci Projection vs. Other Fibonacci Tools
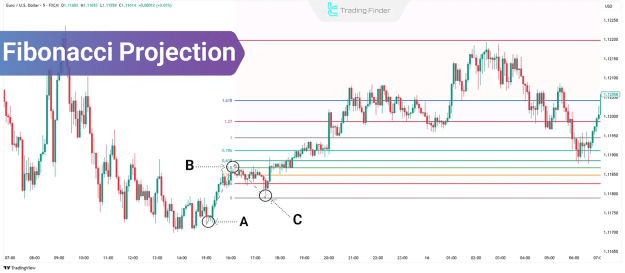
Unlike Fibonacci Retracement, which identifies reversal zones during corrections, Fibonacci Projection focuses on trend continuation. It helps traders set price targets as the trend progresses.
Key Differences:
- Fibonacci Retracement: Uses two points (swing high and low) to find pullback levels.
- Fibonacci Expansion: Measures trend extensions but uses different wave logic.
- Fibonacci Projection: Requires three points (A-B-C) to project future price targets.
How to Draw Fibonacci Projection in TradingView
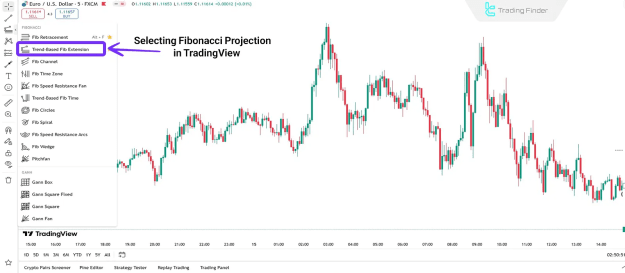
To apply Fibonacci Projection in TradingView, follow these steps:
- Open the Fibonacci Tools Menu
- Navigate to the left toolbar.
- Click the Fibonacci icon (third option from the top).
- Select "Trend-Based Fib Extension."
- Mark the Three Key Points
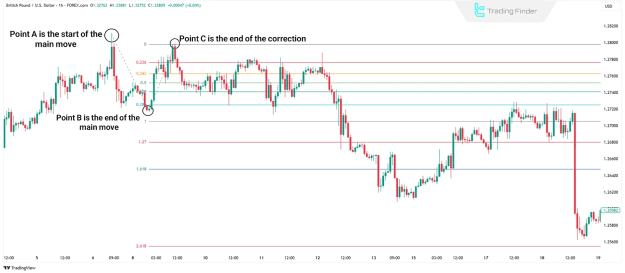
- Point A: Start of the trend (origin).
- Point B: End of the initial trend wave (peak or trough).
- Point C: End of the corrective move (start of the next wave).
- Analyze the Projection Levels
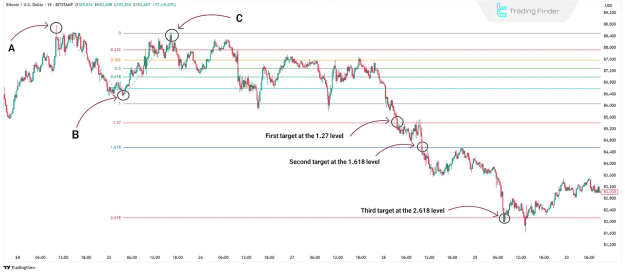
After plotting, the tool will display key Fibonacci ratios (1.00, 1.27, 1.618, 2.618) as potential price targets.
How to Trade Using Fibonacci Projection
Step 1: Identify the Correct Points
- Point A: Beginning of the trend.
- Point B: End of the first impulse wave.
- Point C: End of the retracement (confirms trend continuation).
Step 2: Validate with Additional Tools
For higher accuracy, combine Fibonacci Projection with:
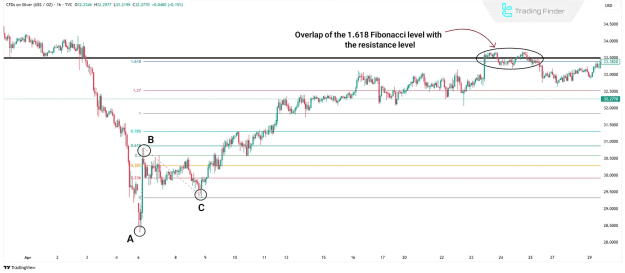
- Support & Resistance: Overlapping levels increase significance.
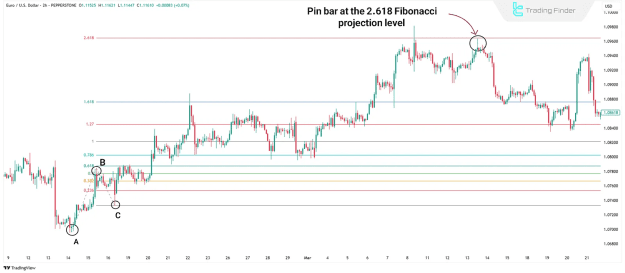
- Candlestick Patterns: Pin bars, engulfing patterns, or dojis near projection levels strengthen signals.
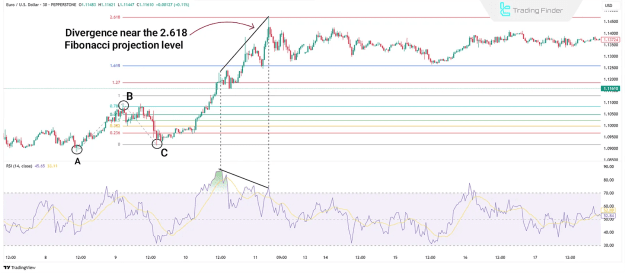
- Indicator Divergence: RSI or MACD divergence can signal trend exhaustion at key levels.
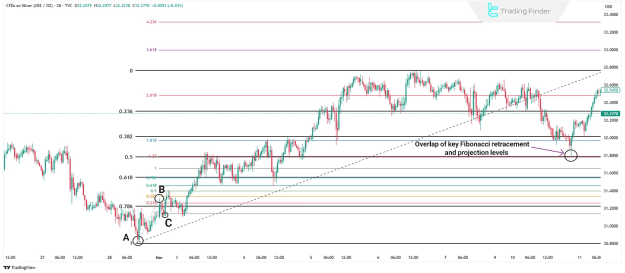
- Fibonacci Retracement: Confluence zones (PRZ - Potential Reversal Zones) improve trade setups.
Step 3: Execute Trades at Key Levels
- Entry: Look for confirmations (e.g., bullish reversal patterns at 1.27 or 1.618 extensions).
- Exit: Use higher extensions (2.618) as profit targets.
Common Mistakes When Using Fibonacci Projection
- Incorrect Point Selection
- Misidentifying points A, B, or C leads to unreliable projections.
- Lack of Confirmation
- Relying solely on Fibonacci levels without candlestick or volume confirmation increases false signals.
- Overuse in Choppy Markets
- Fibonacci Projection works best in trending markets, not sideways conditions.
- Ignoring Higher Timeframes
- Projection levels on daily/weekly charts carry more weight than lower timeframes.
Conclusion
Fibonacci Projection is a valuable tool for traders seeking to identify trend continuation targets. By correctly marking points A, B, and C and combining it with other technical tools, traders can improve their accuracy in setting profit targets and spotting reversals.
Key takeaways:
- Use 1.27, 1.618, and 2.618 as major projection levels.
- Validate signals with candlestick patterns, support/resistance, and divergences.
- Avoid common pitfalls like wrong point selection and lack of confirmation.
By mastering Fibonacci Projection, traders can enhance their trend-following strategies and make more informed trading decisions.