TP & SL Tool: Risk Reward Ratio Calculator RRR MT4 | Prop Firm Protector: Trade Assist Prop Firm Plus TF Expert MT4 | Money Management + DrawDown Protector: Trade Panel Prop Firm Drawdawn Limiter Pro MT4 |Get a free Expert Advisor license via Telegram and WhatsApp
What sets candlesticks apart is their capacity to convey the emotional dynamics of the market, not just raw price data.
Understanding Candlesticks and Their Importance
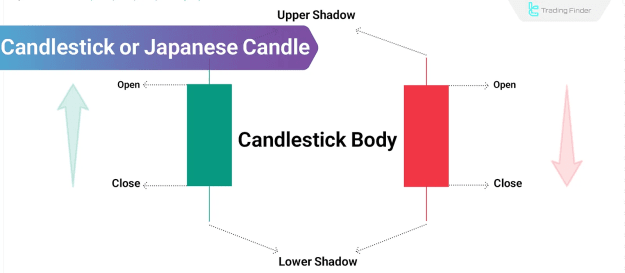
Each candlestick encapsulates the struggle between buyers and sellers. The candle’s body reflects the dominance or weakness of one side, while the shadows (wicks) indicate market volatility, uncertainty, or failed price attempts.
Candlesticks are valued for their visual clarity, ability to condense critical price information, and intuitive depiction of market sentiment. They are widely used across various markets, including Forex, stocks, and cryptocurrencies, on multiple timeframes.
Advantages and Limitations of Candlestick Patterns in Forex and Cryptocurrency
Candlestick patterns illustrate the balance between supply and demand, enhancing market analysis accuracy when properly understood.
The following are key advantages and limitations:
Advantages
- Rapid identification of trend reversals and continuations
- Applicable across all timeframes
- Simplifies analysis without reliance on complex indicators
- Aligns effectively with supply and demand zones
- Supports price action-based trading strategies
Limitations
- Potential for false signals in highly volatile markets
- Requires additional confirmation through volume or other indicators
- Reduced reliability on very low timeframes
- Risk of misinterpretation without adequate experience
- Vulnerable to sudden market-moving news or events
Practical Applications of Candlestick Price Action Patterns
Incorporating candlestick patterns into price action trading involves:
- Detecting supply and demand zones by analyzing raw price movements
- Utilizing pin bars near support and resistance for entry and exit signals
- Minimizing dependence on lagging indicators for faster trade decisions
- Confirming trend reversals or breakouts with engulfing patterns
- Spotting liquidity areas and stop-loss hunting signals
- Enhancing pattern validation by combining with volume analysis
- Interpreting market psychology through patterns like doji that indicate indecision
- Employing single-bar patterns for scalping and multi-bar patterns for swing trading
- Improving performance in volatile conditions by integrating liquidity and volume data
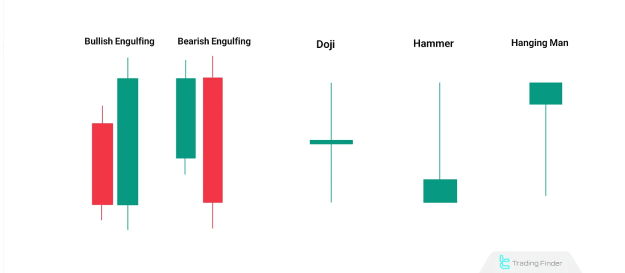
Common Types of Candlesticks
Candlesticks form patterns that may predict market direction changes. Popular types include:
- Doji
- Hammer
- Hanging Man
- Morning Star and Evening Star
For more detailed information, consult our article on Types of Candlestick Patterns.
How to Interpret Japanese Candlestick Charts
Candlestick charts can be applied across all timeframes, from seconds to daily and beyond. Each candlestick consists of:
- Open price
- Close price
- High price
- Low price
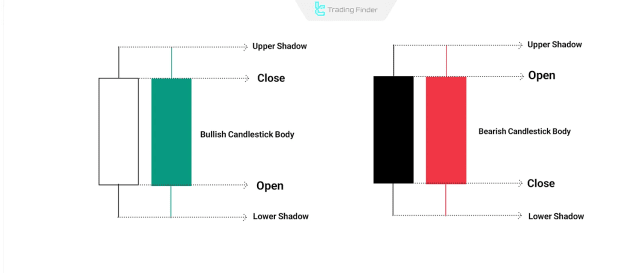
A candle with a close higher than the open is typically hollow or green, signaling buying pressure. Conversely, a candle with a close lower than the open is filled or red, indicating selling pressure.
The real body is the section between open and close prices, while the shadows (or wicks) extend to the high and low of the period.
Conclusion
Candlesticks serve as essential analytical tools beyond mere price visualization. By providing key price points, they enable traders to evaluate market momentum and trend direction effectively.
When combined into recognizable patterns, candlesticks assist in identifying precise entry and exit points. Their full potential is realized when used in conjunction with price action techniques and complementary trading tools.