TP & SL Tool: Risk Reward Ratio Calculator RRR MT5 | Prop Firm Protector: Trade Assist Prop Firm Plus TF Expert MT5 | Money Management + DrawDown Protector: Trade Panel Prop Firm Drawdawn Limiter Pro MT5 |Get a free Expert Advisor license via Telegram and WhatsApp
What Is the RTM Diamond Pattern?
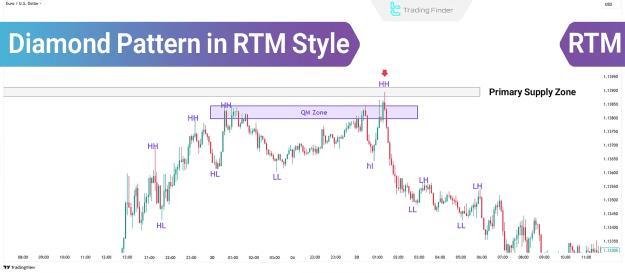
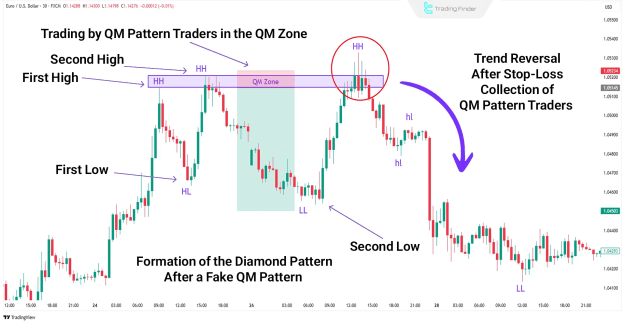
The RTM Diamond Pattern is a price-action-based reversal formation. It typically appears after a Quasimodo (QM) pattern has been invalidated. For the diamond to form, price must re-enter the QM Zone and fail to behave in a Quasimodo-like manner. Instead, it triggers stop-losses of trapped traders before reversing in the opposite direction.
Key Stop-Loss Groups Affected:
- Sellers at the first high
- Buyers at the first low
- Sellers at the second high
- Buyers at the second low
- Sellers within the QM Zone
This stop sweep clears the liquidity required by institutions, setting the stage for a sharp trend reversal.
How to Recognize the RTM Diamond Pattern
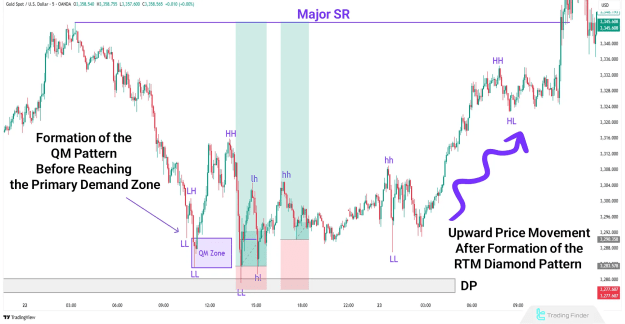
To identify the diamond pattern, a strong understanding of RTM supply and demand zones is essential. The pattern usually appears before price reaches a primary supply or demand level, with a failed Quasimodo signaling the potential reversal.
Characteristics of the Setup:
- Occurs after a Quasimodo violation
- Appears prior to reaching the core RTM zone
- Follows a fake QM and a liquidity sweep
- Leads to a strong reversal move in the opposite direction
Step-by-Step: Trading the RTM Diamond Pattern
Step 1: Identify Key Supply and Demand Zones
- Use core RTM concepts such as FTR (Failure to Return), Flag Limits, and Decision Points (DP) to mark significant zones.
- A valid zone must be touched or penetrated, even if only by one pip.
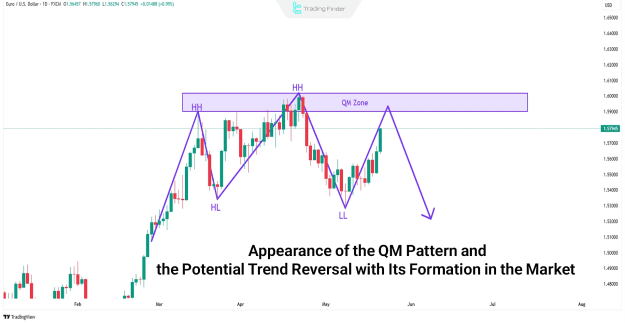
Step 2: Spot the Quasimodo Pattern
- Look for a Quasimodo structure forming just before price reaches the key RTM zone.
- Retail traders often trade the QM, and their stop-outs create the conditions for the diamond pattern.
- A stop-out of the QM setup is a major clue that the diamond may follow.
Step 3: Observe the QM Violation and CP Formation
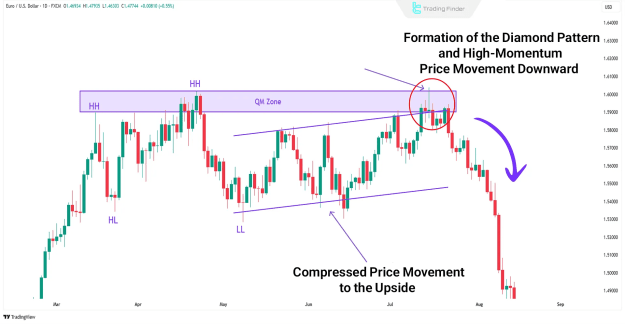
- During the violation of the QM, price typically makes a Compressed Price (CP) move within the QM Zone.
- This compression is a signal of growing institutional interest and potential for stop hunting.
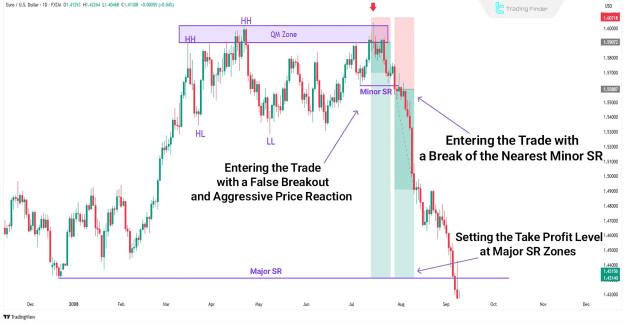
Step 4: Look for a Fake Break or Aggressive Price Reaction
- A fake break or a sharp candle with long wicks often signals stop-loss sweeps.
- This movement generates the liquidity needed for the price to shift direction.
Step 5: Enter in the Direction of the New Trend
- After the fake break, price typically moves with strong momentum.
- Use candle confirmations, minor structure breaks, or technical indicators to confirm entry.
- Place your stop behind the fake break high/low and set your take-profit at the next significant SR level.
Real-World Example: RTM Diamond Pattern on EUR/USD
A bullish reversal after a Diamond Pattern forms demonstrates how institutional liquidity grabs are followed by trend shifts. In this setup, price forms a fake QM, sweeps stops, and then rallies from the demand zone with strong bullish momentum.
Key Insights When Using the RTM Diamond Pattern
- High Probability Setup: The pattern typically appears before price reaches the main RTM zone (FTR, Flag, DP).
- QM Failure Is Crucial: The invalidation of the QM is often the trigger for the Diamond.
- Liquidity Sweep Is Essential: The fake break must clear several stop groups before the reversal.
- Minor SR Break for Confirmation: Wait for a nearby support/resistance level break to validate the setup.
- Momentum Clue: A sharp post-sweep move suggests that institutional activity has concluded, and trend reversal is underway.
Conclusion
The RTM Diamond Pattern is a sophisticated price-action reversal structure used by professional traders within the RTM framework. Emerging after a Quasimodo failure, it traps multiple trader groups to enable institutional liquidity collection. Once complete, it often results in high-probability entries with favorable risk-to-reward ratios.
By understanding how this pattern manipulates market sentiment and liquidity, traders can better position themselves in line with institutional flows, rather than being caught by them.