Compared to single candlestick patterns, dual candlestick patterns provide deeper insights into market sentiment, although they require more time to detect and confirm.
TP & SL Tool: Risk Reward Ratio Calculator RRR MT4 | Prop Firm Protector: Trade Assist Prop Firm Plus TF Expert MT4 | Money Management + DrawDown Protector: Trade Panel Prop Firm Drawdawn Limiter Pro MT4 |Get a free Expert Advisor license via Telegram and WhatsApp
What Are Dual Candlestick Patterns?
Dual candlestick patterns consist of two candlesticks positioned adjacently on the price chart. Their interpretation depends on the formation’s structure, size, and the relationship between the two candles.
Key Characteristics
- Composed of two consecutive candles
- Signal potential reversals in prevailing market trends
- Require analysis within the broader market context
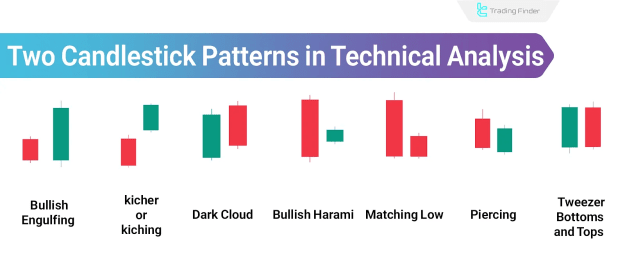
Types of Dual Candlestick Patterns
The following are the most widely used dual candlestick patterns in financial market analysis:
- Bullish Engulfing
- Bearish Engulfing
- Kicking (Kicher)
- Dark Cloud Cover
- Bullish Harami
- Bearish Harami
- Matching Low
- Piercing Pattern
- Tweezer Bottoms and Tops
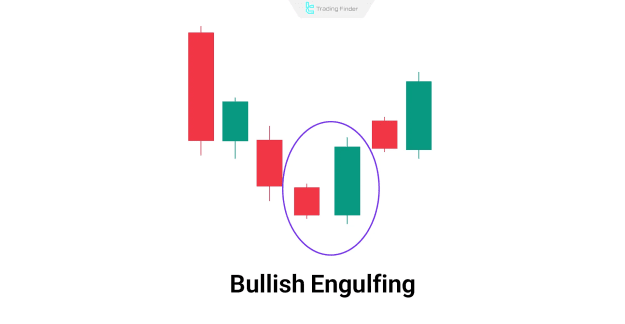
Bullish Engulfing Pattern
The Bullish Engulfing pattern is a strong bullish reversal formation appearing at the end of a downtrend.
Characteristics:
- A small bearish candle followed by a large bullish candle that completely engulfs the first.
- Signal strength increases with a smaller first candle and a larger engulfing second candle.
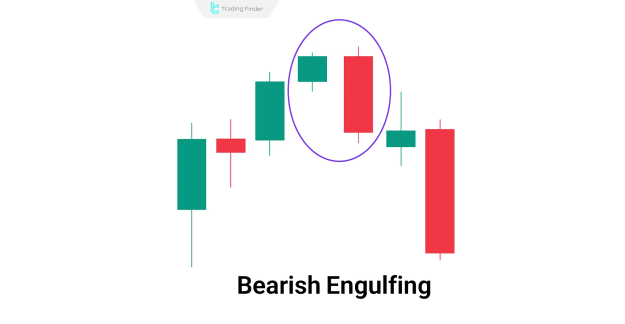
Bearish Engulfing Pattern
The Bearish Engulfing pattern indicates a potential bearish reversal, usually at the top of an uptrend.
Characteristics:
- First candle is bullish, followed by a large bearish candle that fully engulfs the prior candle.
- The pattern is more reliable when the first candle is small and the second is significantly larger.
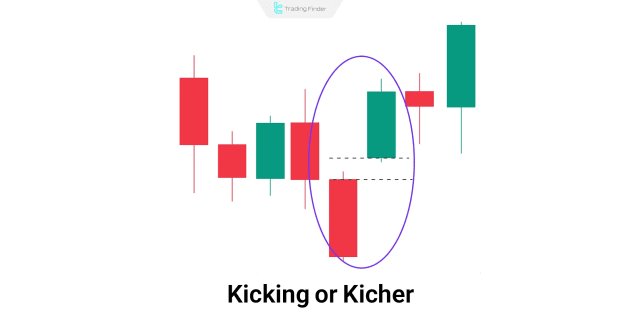
Kicking (Kicher) Pattern
The Kicking pattern signifies an abrupt reversal in market direction, marked by a gap between the two candles.
Characteristics:
- First candle aligns with the existing trend.
- Second candle is a strong opposite candle with a significant gap up or down, signalling sudden market sentiment shifts.
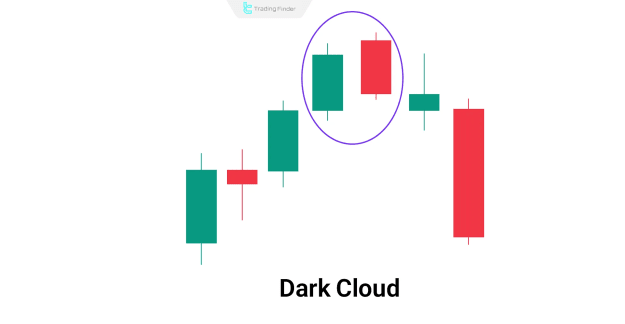
Dark Cloud Cover Pattern
Dark Cloud Cover is a bearish reversal pattern emerging after an uptrend, indicating increased selling pressure.
Characteristics:
- The first candle is bullish.
- The second candle opens above the previous close but closes below the midpoint of the first candle.
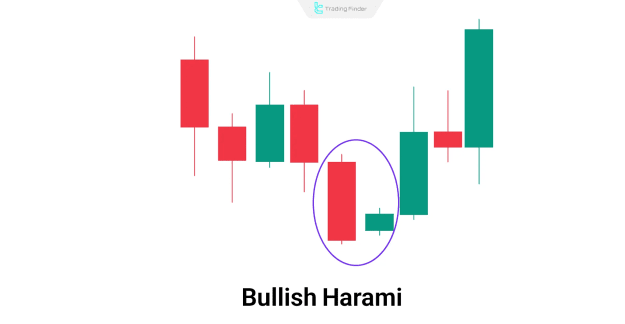
Bullish Harami Pattern
The Bullish Harami signals a potential bullish reversal during a downtrend, though confirmation is required before action.
Characteristics:
- A large bearish candle followed by a small bullish candle contained entirely within the first candle’s body.
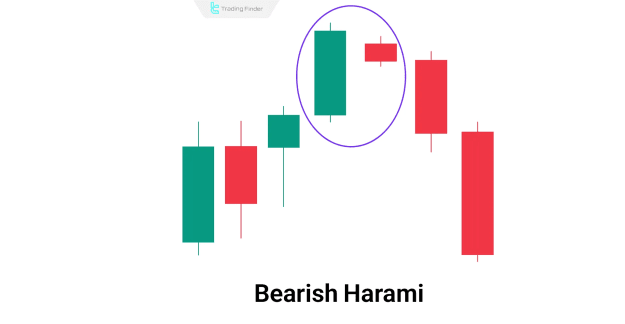
Bearish Harami Pattern
The Bearish Harami pattern indicates a potential bearish reversal, typically forming at the end of an uptrend.
Characteristics:
- Large bullish candle followed by a smaller bearish candle fully within its range, showing weakening buying momentum.
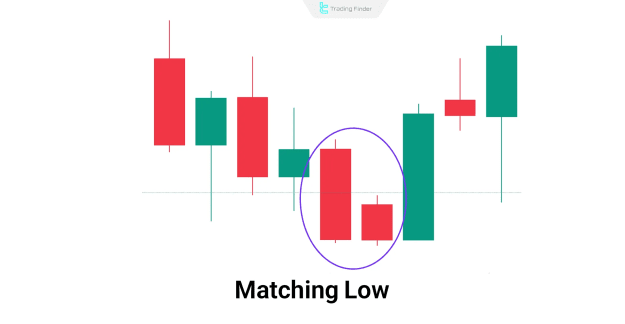
Matching Low Pattern
Matching Low indicates strong short-term support levels, forming a base for potential upward reversals.
Characteristics:
- Two bearish candles where the second opens higher but closes at the same level as the first, indicating buyer support.
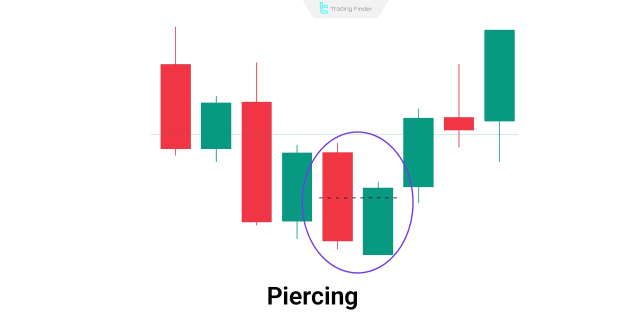
Piercing Pattern
The Piercing pattern is a bullish reversal formation found at the bottom of downtrends.
Characteristics:
- First candle is bearish.
- Second candle opens below the first candle’s close and closes above its midpoint, demonstrating strong buying pressure.
Tweezer Bottoms and Tops Pattern
Tweezer patterns occur at market tops or bottoms, indicating potential reversals based on identical highs or lows.
Characteristics:
- Tops: a bullish candle followed by a bearish candle with matching highs.
- Bottoms: a bearish candle followed by a bullish candle with matching lows.
Pros and Cons of Dual Candlestick Patterns
Advantages
- Identify potential trend reversals
- Enhance market forecasting accuracy
- Confirm trade entry opportunities
Disadvantages
- Lower predictive accuracy than complex multi-candle patterns
- Require detailed analysis and trader expertise
- Risk of false signals in volatile markets
Comparison with Single and Triple Candlestick Patterns
Dual candlestick patterns offer a balance between speed and reliability. Single candlestick patterns provide quick signals with lower predictive power, while triple candlestick formations offer higher confirmation strength but require more time to form.
Conclusion
Dual Candlestick Patterns play a critical role in technical analysis, providing valuable insights into trend reversals by analysing the relationship between two candles. Effective use of these patterns demands experience, contextual market understanding, and confirmation with other technical indicators to optimise trading decisions.