TP & SL Tool: Risk Reward Ratio Calculator RRR MT4 | Prop Firm Protector: Trade Assist Prop Firm Plus TF Expert MT4 | Money Management + DrawDown Protector: Trade Panel Prop Firm Drawdawn Limiter Pro MT4 |Get a free Expert Advisor license via Telegram and WhatsApp
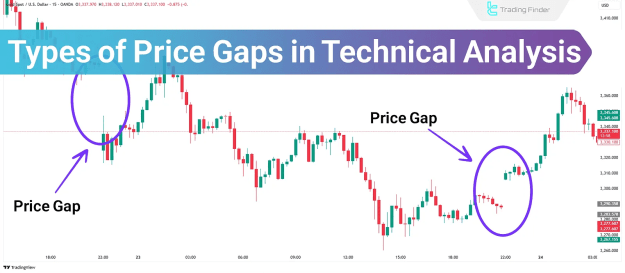
Types of Price Gaps in Technical Analysis
Price gaps are classified into four primary categories, each offering unique insights into market behavior:
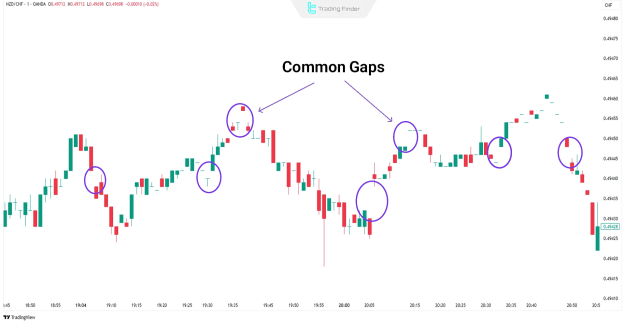
1. Common Gap
Common gaps frequently appear in sideways or choppy markets and are not typically associated with major trend changes.
Key Characteristics:
- Also referred to as "area gaps" or "trading gaps."
- Small in size and usually filled quickly.
- Occur within consolidation phases.
- Do not provide strong trading signals.
Example:
In a 1-minute chart of NZD/CHF, common gaps may appear during low-volatility periods, often closing within a few candles.
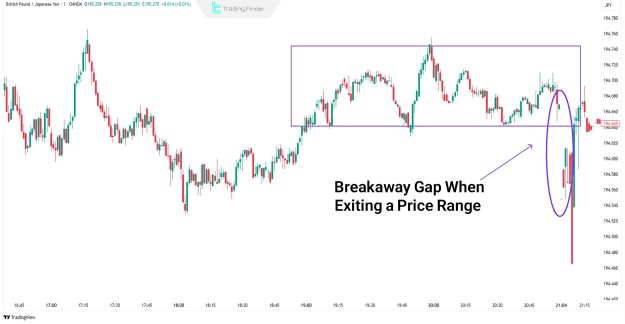
2. Breakaway Gap
A breakaway gap forms when price exits a consolidation phase, breaking through key support or resistance with strong momentum.
Key Characteristics:
- Signals the start of a new trend.
- Accompanied by high trading volume.
- Indicates a strong shift in market sentiment.
- Rarely gets filled immediately.
Example:
On a GBP/JPY 1-minute chart, a breakaway gap may occur after a prolonged range-bound movement, leading to a sustained uptrend or downtrend.
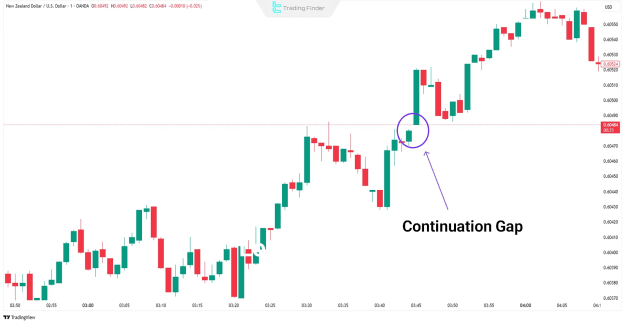
3. Continuation Gap (Runaway Gap)
Continuation gaps appear mid-trend, reinforcing the prevailing market direction as new traders enter positions.
Key Characteristics:
- Occurs within strong trending markets.
- Reflects sustained buying/selling pressure.
- Often remains unfilled for extended periods.
- Can be triggered by news events.
Example:
On NZD/USD (1-minute chart), a runaway gap may form during a strong uptrend, confirming bullish momentum.
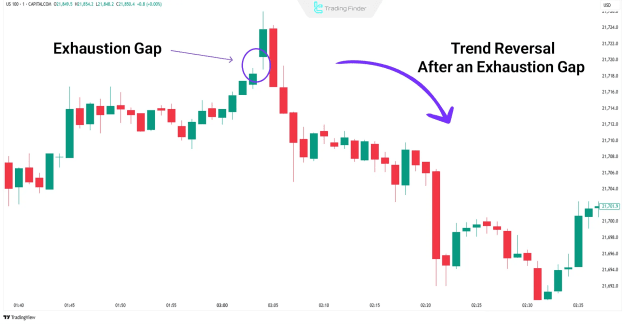
4. Exhaustion Gap
Exhaustion gaps appear near the end of a trend, signaling weakening momentum before a reversal.
Key Characteristics:
- Forms after prolonged price movements.
- Indicates potential trend exhaustion.
- Often followed by a reversal.
- High volume accompanies the gap.
Example:
On the US100 index (1-minute chart), an exhaustion gap near a resistance level may precede a bearish reversal.
Practical Applications of Price Gaps in Trading
Price gaps provide valuable insights for traders, including:
- Trend Confirmation: Breakaway and continuation gaps validate strong trends.
- Reversal Signals: Exhaustion gaps warn of potential trend reversals.
- Support/Resistance Levels: Gaps often act as future price barriers.
- Volume Analysis: High volume gaps carry stronger significance.
Key Considerations When Trading Gaps
- Timing: Different gaps have varying implications based on market context.
- Volume Confirmation: High volume increases gap reliability.
- Gap Fill Probability: Common gaps fill quickly, while breakaway/continuation gaps may remain open.
Special Cases: CME Gaps & Weekly Opening Gaps
CME Gaps in Cryptocurrency Markets
Since Bitcoin futures on the Chicago Mercantile Exchange (CME) trade only on weekdays, price discrepancies (CME gaps) often form between Friday’s close and Monday’s open. Crypto traders monitor these gaps for potential fill opportunities.
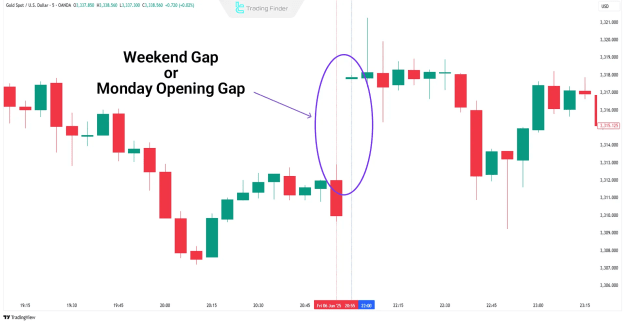
Weekly Opening Gaps
Macroeconomic news over the weekend can cause opening gaps in forex and stock markets. These gaps may act as breakaway or continuation signals, depending on market conditions.
Conclusion
Price gaps serve as critical indicators in technical analysis, offering insights into trend strength, reversals, and key price levels. By accurately identifying common, breakaway, continuation, and exhaustion gaps, traders can enhance their decision-making process.
Whether analyzing forex, stocks, or cryptocurrencies, understanding gap dynamics helps traders capitalize on emerging opportunities while managing risk effectively.