TP & SL Tool: Risk Reward Ratio Calculator RRR MT5 | Prop Firm Protector: Trade Assist Prop Firm Plus TF Expert MT5 | Money Management + DrawDown Protector: Trade Panel Prop Firm Drawdawn Limiter Pro MT5 |Get a free Expert Advisor license via Telegram and WhatsApp
What Is the Horn Pattern?
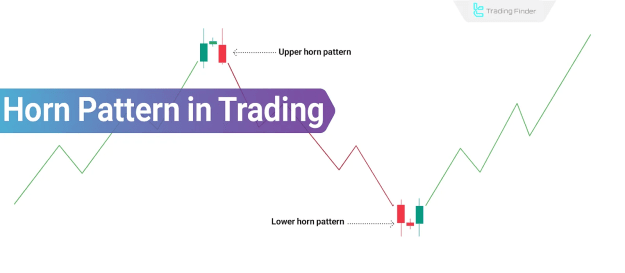
The Horn Pattern forms when the price makes two sharp, rapid moves in one direction (up or down) but fails to sustain momentum, indicating a potential trend reversal.
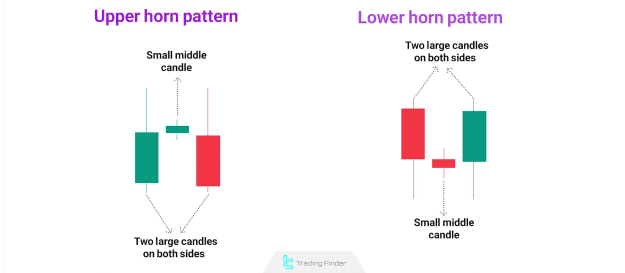
- Horn Top (Bearish Reversal): Appears at the peak of an uptrend, with two large bullish candles and a small middle candle. Suggests weakening buying pressure and an impending downtrend.
- Horn Bottom (Bullish Reversal): Forms at the bottom of a downtrend, with two large bearish candles and a small middle candle. Indicates fading selling pressure and a potential uptrend.
Despite similarities to Double Tops or Double Bottoms, the Horn Pattern triggers faster, more volatile reversals, often accompanied by higher trading volume.
Analyzing the Horn Top and Horn Bottom
1. Horn Top (Bearish Reversal)
- Appearance: After a strong uptrend, two large bullish candles form with a small candle in between.
- Significance: Shows that despite two strong upward pushes, bullish momentum is fading.
- Confirmation: A bearish breakout below the low of the right candle confirms the reversal.
2. Horn Bottom (Bullish Reversal)
- Appearance: At the end of a downtrend, two large bearish candles form with a small candle in the middle.
- Significance: Indicates that sellers failed to break support, leading to a potential bullish reversal.
- Confirmation: A bullish breakout above the high of the right candle validates the reversal.
Trading Strategies for the Horn Pattern
1. Breakout Confirmation with a Closed Candlestick
- Wait for a full candlestick close outside the Horn’s range (above for Horn Bottom, below for Horn Top).
- Avoid entering on wick breakouts—only confirmed closes matter.
2. Entry Point
- Horn Top: Enter short after a confirmed close below the right candle’s low.
- Horn Bottom: Enter long after a confirmed close above the right candle’s high.
- For lower timeframes, fine-tune entries using smaller candlestick patterns.
3. Setting Profit Targets
Use one of these methods:
- Support/Resistance Levels: Previous price reaction zones.
- Fibonacci Extensions: Target 1.618 or 2.618 of the Horn’s height.
- Place targets before congestion zones for higher accuracy.
4. Stop-Loss Placement
- Horn Top: Place stop-loss above the right candle’s high.
- Horn Bottom: Place stop-loss below the right candle’s low.
- Adjust position size if the stop-loss is too wide.
Real-World Trading Examples
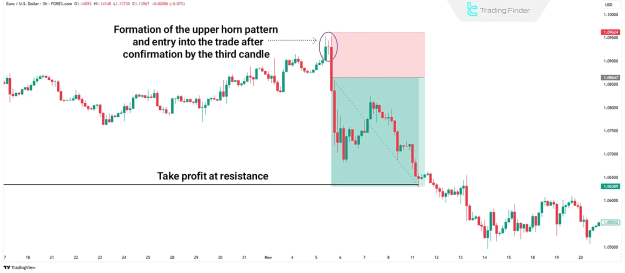
Example 1: Bearish Horn Top on EUR/USD
- After an uptrend, two large bullish candles form with a small candle in between.
- A strong bearish breakout below the right candle confirms the reversal.
- Traders enter short, targeting previous support or Fibonacci levels.
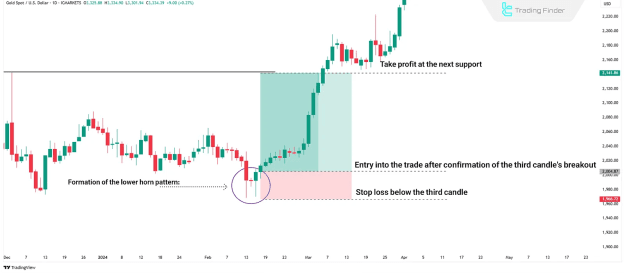
Example 2: Bullish Horn Bottom on XAU/USD (Gold)
- At the end of a downtrend, two large bearish candles appear with a small middle candle.
- A bullish breakout above the right candle signals a reversal.
- Traders enter long, aiming for resistance or Fibonacci extensions.
Conclusion
The Horn Pattern is a high-probability reversal signal that relies on:
- Three-candlestick structure (two large, one small).
- Breakout confirmation for valid entries.
- Strategic stop-loss and target placement.
Unlike other patterns, it triggers fast and volatile reversals, making it ideal for short-term traders. Always consider:
- Trend context (appears at extremes).
- Volume confirmation (higher volume strengthens validity).
- Risk management (proper stop-loss and position sizing).
By mastering the Horn Pattern, traders can capitalize on early trend reversals with precision.