Traders often apply the SMA as a dynamic support and resistance tool. Moreover, combining SMAs of different time periods enables the development of effective and versatile trading strategies.
TP & SL Tool: Risk Reward Ratio Calculator RRR MT5 | Prop Firm Protector: Trade Assist Prop Firm Plus TF Expert MT5 | Money Management + DrawDown Protector: Trade Panel Prop Firm Drawdawn Limiter Pro MT5 |Get a free Expert Advisor license via Telegram and WhatsApp
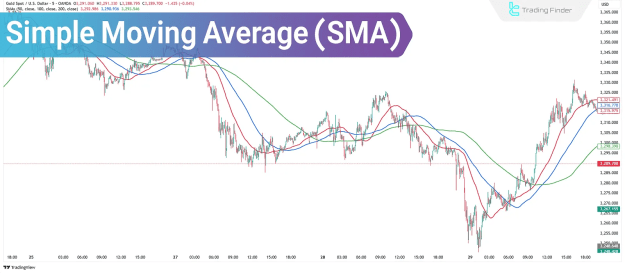
What Is a Simple Moving Average (SMA)?
The SMA calculates the average price over a specified period and represents it as a continuous line on the price chart.
Because it gives equal weight to all data points, the SMA reacts slowly to sudden price changes, making it ideal for identifying longer-term trends.
Advantages and Disadvantages of the Simple Moving Average
Understanding the benefits and limitations of the SMA is essential when applying it in trading.
Advantages:
- Simple to calculate and interpret
- Effective in identifying market trends
- Smooths out short-term price fluctuations
- Can serve as dynamic support and resistance
- Applicable on various timeframes
Disadvantages:
- Lagging indicator with delayed signals
- Less responsive to recent price movements
- Risk of false trend identification
- Occasional inaccurate signals
- Less reliable in highly volatile markets
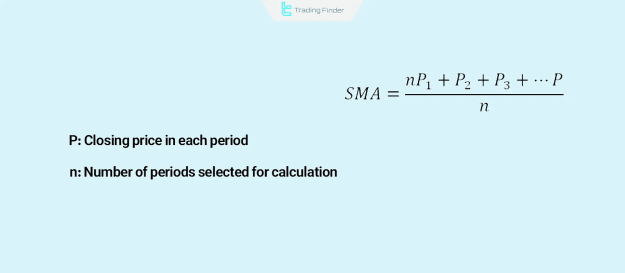
How Is the Simple Moving Average (SMA) Calculated?
The SMA is calculated by summing the closing prices over a chosen period and dividing by the number of periods. This equal weighting differentiates it from other moving averages.
Applications of the Simple Moving Average (SMA)
The SMA filters out price volatility and is best suited for detecting long-term market trends. Its continuous line can act as a dynamic or moving support/resistance level.
How to Use the Simple Moving Average (SMA) in Trading
To maximize its effectiveness, traders should integrate the SMA with their overall trading strategy. It is commonly applied in trend-following strategies like swing trading, especially on higher timeframes.
While it can be used alone, combining multiple SMAs or other indicators usually improves reliability.
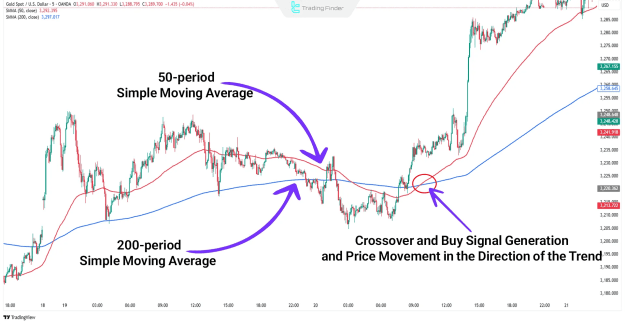
Trading Example Using the Simple Moving Average (SMA)
A typical approach uses the 50-period and 200-period SMAs. When the 50 SMA crosses above the 200 SMA below the price, it generates a bullish signal indicating a potential buy opportunity.
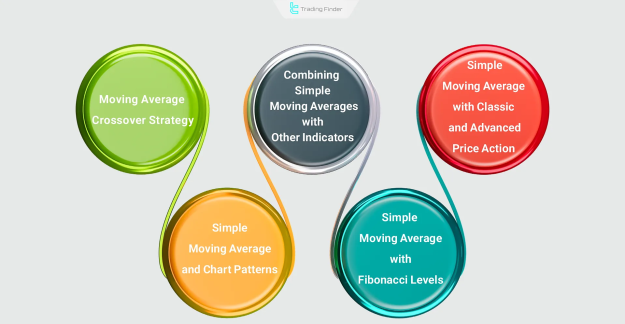
Popular Trading Strategies Based on SMA
The SMA is a versatile tool used in various strategies such as:
- SMA crossover strategies
- Combining SMA with momentum or volume indicators
- Integrating SMA with price action analysis
- Using SMA alongside chart patterns
- Applying SMA with Fibonacci retracement levels
Difference Between SMA and EMA
The SMA provides a smooth, evenly weighted average ideal for long-term trend analysis. The Exponential Moving Average (EMA), however, gives more weight to recent prices, reacting faster and making it preferable for short-term or volatile market conditions.
Recommended SMA Settings
Common SMA periods for trend analysis are 20, 50, 100, and 200. Some traders use shorter or unconventional periods like 9, 14, 26, or 103 depending on their approach.
It is important to customize settings to suit specific trading strategies and market environments.
Conclusion
The Simple Moving Average (SMA) is a fundamental indicator used to identify dynamic support/resistance levels and long-term trends.
By assigning equal weight to all data points in the selected period, the SMA smooths market noise and provides traders with a clear picture of market direction.