TP & SL Tool: Risk Reward Ratio Calculator RRR MT4 | Prop Firm Protector: Trade Assist Prop Firm Plus TF Expert MT4 | Money Management + DrawDown Protector: Trade Panel Prop Firm Drawdawn Limiter Pro MT4 |Get a free Expert Advisor license via Telegram and WhatsApp
What Is the Simple Moving Average (SMA)?
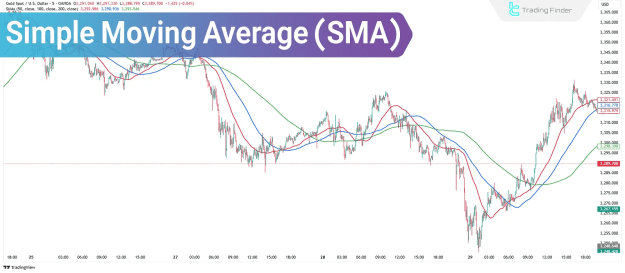
The Simple Moving Average (SMA) is a technical indicator that calculates the average closing prices over a specified time period and plots them as a continuous line on the price chart.
- The SMA assigns equal weight to all data points within the selected period.
- It reacts more slowly to sharp price fluctuations, making it suitable for identifying longer-term trends.
- It is often used in trend-following systems to determine the overall direction of the market.
Advantages and Disadvantages of the SMA
Understanding the strengths and limitations of the SMA is crucial for efficient implementation in trading strategies.
Advantages:
- Simple to calculate and interpret
- Effective in identifying long-term market trends
- Reduces price noise, offering a clearer view of market direction
- Helps in detecting support and resistance levels
- Applicable across different timeframes and asset classes
Disadvantages:
- Lagging indicator; slow to respond to sudden price movements
- Not ideal for short-term trading or high-volatility conditions
- May produce false signals during consolidation periods
- Low sensitivity to recent price action
- Risk of misinterpreting trend reversals
How to Calculate the SMA
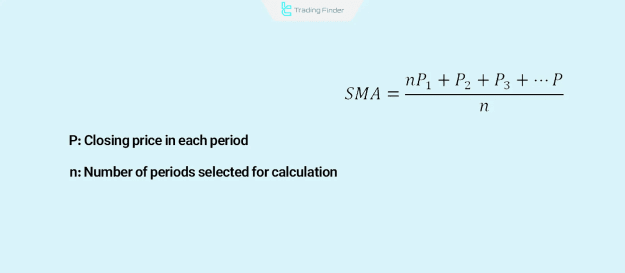
The SMA is computed using a straightforward arithmetic formula. It averages the closing prices over a defined number of periods:
SMA Formula:
SMA = (Sum of Closing Prices over N Periods) / N
Where:
- PPP represents the closing prices
- nnn is the number of periods used for the average
The result is plotted as a smooth curve on the price chart.
Applications of the Simple Moving Average
The Simple Moving Average is primarily used to:
- Identify the direction of long-term trends
- Filter out short-term market volatility
- Serve as a moving support/resistance line
- Define trade zones and guide entry/exit decisions
It is most effective in trending markets and less useful during sideways or choppy price action.
How to Use SMA in Technical Analysis
To maximize the effectiveness of the SMA, traders should:
- Apply longer-period SMAs (e.g., 50, 100, or 200) on higher timeframes for swing or position trading
- Use SMA in combination with other indicators like RSI, MACD, or price action techniques
- Avoid relying solely on the SMA for confirmation; it should be part of a broader analysis approach
A popular use case is the SMA crossover strategy, where a shorter SMA crossing above a longer SMA is viewed as a bullish signal and vice versa.
Trading Example: SMA Crossover Strategy
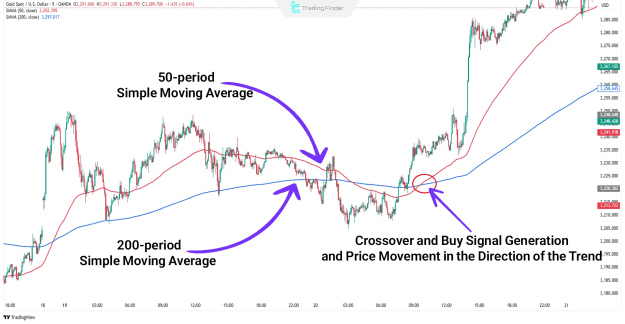
In this trading setup:
- A 50-period SMA and a 200-period SMA are applied
- When the 50-SMA crosses above the 200-SMA, a buy signal is generated
- If the 50-SMA falls below the 200-SMA, it may signal a potential trend reversal or selling opportunity
This method is widely used in trend confirmation systems.
SMA-Based Trading Strategies
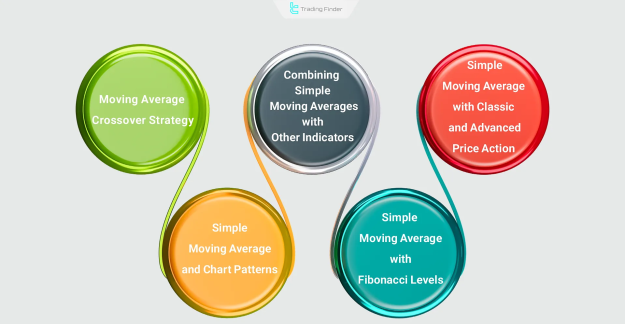
The SMA can be incorporated into several technical trading strategies:
- Multiple SMA crossover strategies
- Combining SMA with momentum indicators (e.g., RSI, Stochastic)
- Using SMA to validate price action patterns
- Aligning SMA with Fibonacci retracement levels
- Integrating SMA in support and resistance breakouts
These strategies aim to enhance decision-making by providing objective trend-based signals.
Difference Between SMA and EMA
While both are moving averages, there are key differences:
- SMA: Averages all data points equally; suitable for long-term analysis
- EMA (Exponential Moving Average): Gives more weight to recent prices; reacts faster to new data, making it ideal for short-term trading and volatile markets
Traders choose between SMA and EMA based on their specific strategy and timeframe.
Best SMA Settings
Standard SMA settings include:
- 20, 50, 100, and 200 periods for long-term trend analysis
- Shorter periods like 9, 14, 26, and 103 are used for more refined strategies
The ideal setting depends on:
- Market conditions
- Trading style (scalping, swing trading, long-term investing)
- Asset volatility
Customizing the SMA setting is essential for aligning it with the overall trading framework.
Conclusion
The Simple Moving Average (SMA) is a fundamental indicator in technical analysis that serves to identify market trends and dynamic support/resistance levels. Its simplicity and versatility make it a cornerstone of many trend-following trading strategies.
While it provides clarity in directional movement by smoothing out price data, traders should be cautious of its lagging nature and consider combining it with complementary indicators to improve accuracy and reduce false signals.