TP & SL Tool: Risk Reward Ratio Calculator RRR MT5 | Prop Firm Protector: Trade Assist Prop Firm Plus TF Expert MT5 | Money Management + DrawDown Protector: Trade Panel Prop Firm Drawdawn Limiter Pro MT5 |Get a free Expert Advisor license via Telegram and WhatsApp
Trading with Candlestick Patterns in Support and Resistance
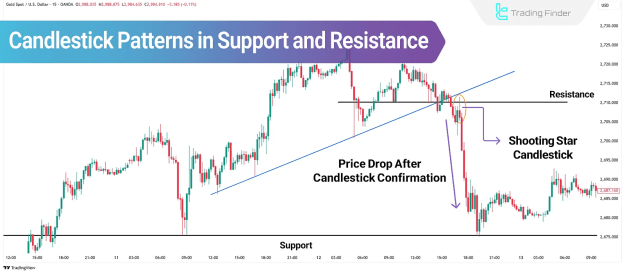
Using candlestick formations within S&R zones provides actionable trade signals. The most effective patterns include:
- Shooting Star (bearish reversal at resistance)
- Hammer (bullish reversal at support)
- Hanging Man (bearish reversal after uptrend)
These patterns fall into two primary categories:
1. Reversal Candlestick Patterns
Reversal signals indicate potential trend shifts and include:
- Hammer – Forms at support with a long lower shadow and small upper body.
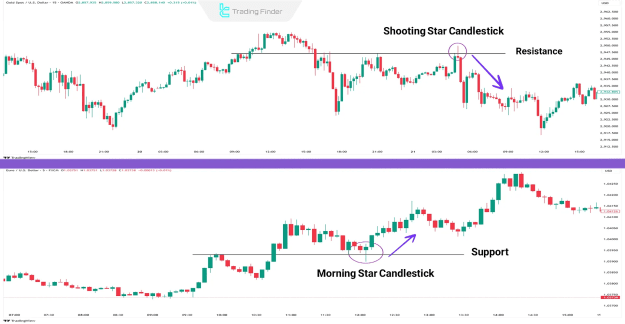
- Morning Star – A three-candle bullish reversal pattern appearing at support.
- Pin Bar – Features a long wick and small body, signaling rejection at key levels.
- Shooting Star – Bearish reversal at resistance with a long upper wick.
These patterns gain higher reliability when aligned with major S&R levels and additional technical confirmations.
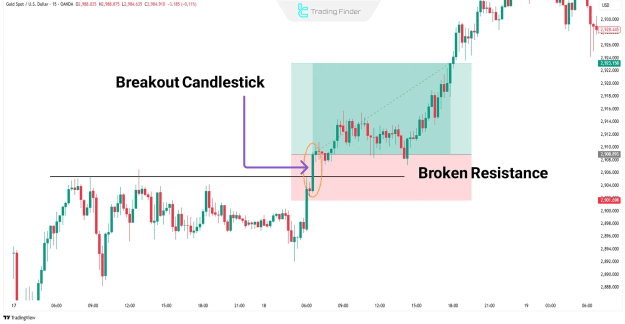
2. Breakout Candlestick Patterns
Breakout candles signify strong trend momentum and often appear when price breaches S&R. Key characteristics include:
- Large real body with minimal shadows.
- Strong closing beyond the breakout level.
- Marubozu candles (no shadows) indicate powerful directional moves.
A valid breakout candle confirms trend strength and increases trade success probability.
Types of Support and Resistance Levels
S&R zones are classified into three main types:
- Static Levels – Horizontal price zones where reactions frequently occur.
- Dynamic Levels – Trendlines or moving averages acting as sloping S&R.
- Confluence Zones (PRZ) – Overlapping static and dynamic levels, offering the strongest signals.
How to Identify Support and Resistance Zones
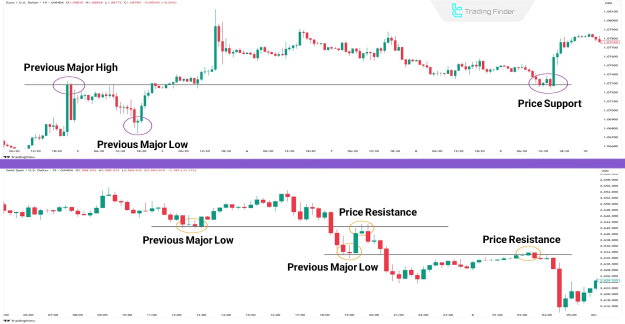
1. Major Highs and Lows
Key swing points where price reverses indicate high-volume order zones. These levels often trigger strong reactions, making them ideal for candlestick-based entries.
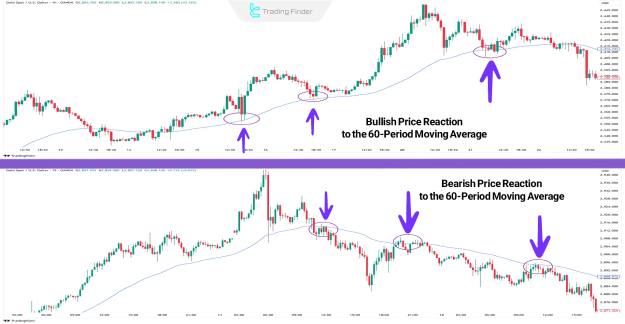
2. Moving Averages as Dynamic S&R
A well-tuned 60-period Moving Average (MA) can act as dynamic support in uptrends and resistance in downtrends. Price reactions near the MA provide high-probability trade setups.
How to Trade Candlestick Patterns in S&R
Entry with Reversal Patterns
- Uptrend at Support → Look for bullish reversal candles (Hammer, Morning Star).
- Downtrend at Resistance → Seek bearish reversal candles (Shooting Star, Pin Bar).
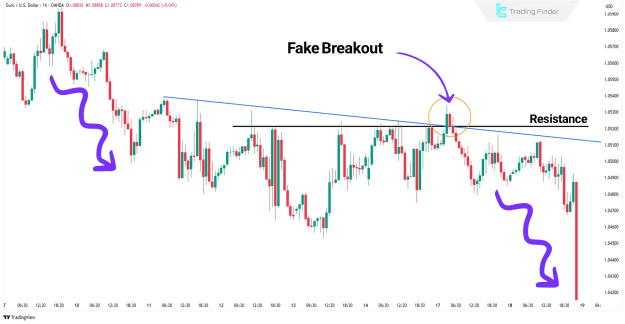
Entry with Breakout Patterns
- A strong full-bodied candle closing beyond S&R confirms breakout validity.
- Avoid false breakouts by waiting for candle closure outside the zone.
Stop Loss Placement
- Set stops beyond the confirming candle’s extreme (slightly beyond wicks for buffer).
Take Profit Strategies
- Target next S&R zone for logical exits.
- Watch for opposite candlestick reversals to secure profits early.
Key Considerations for High-Probability Trading
- Repeated Tests Weaken Levels – Each retest increases breakout likelihood.
- Role Reversal – Broken resistance often becomes support (and vice versa).
- Confluence Zones – Combined static/dynamic levels enhance signal strength.
- Trend Alignment – Candlestick patterns work best in trending markets.
- Higher Timeframes – Daily/4H charts provide more reliable signals.
Conclusion
Mastering candlestick patterns within S&R zones refines trade timing and accuracy. Combining these with volume analysis, multi-timeframe confirmation, and trend structure further enhances trading precision.
By integrating these principles, traders can improve win rates and execute high-confidence setups in any market condition.