- The highest and lowest price points within a timeframe;
- Strong market responses to significant price levels.
TP & SL Tool: Risk Reward Ratio Calculator RRR MT4 | Prop Firm Protector: Trade Assist Prop Firm Plus TF Expert MT4 | Money Management + DrawDown Protector: Trade Panel Prop Firm Drawdawn Limiter Pro MT4 |Get a free Expert Advisor license via Telegram and WhatsApp
Wicks are critical in forex education for revealing short-term support or resistance zones, indicating potential reversals or trend continuations.
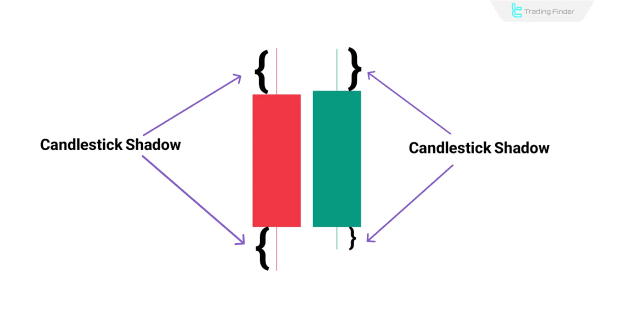
Candlestick Shadows and Their Structure
Each candlestick is composed of:
- Body: Reflecting the open and close prices.
- Wicks (Shadows): Thin lines that extend beyond the body, indicating intraperiod high and low prices.
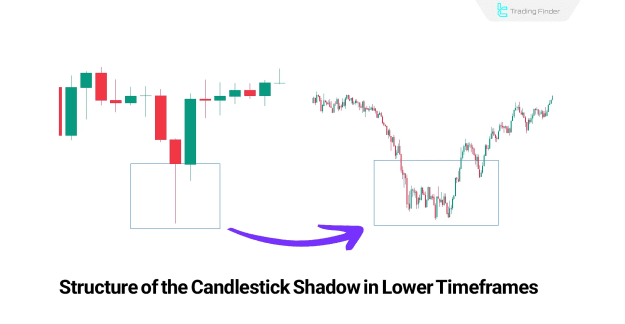
Formation of Wicks
For precise analysis in ICT:
- Identify the wick on the primary (higher) timeframe.
- Shift to lower timeframes to examine its internal composition.
This approach unveils:
- The microstructure within the wick formed by smaller candles;
- Rapid price changes and aggressive liquidity reactions.
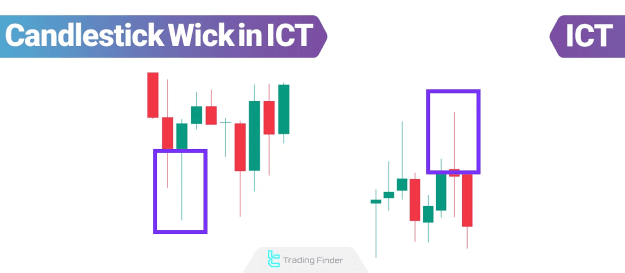
Detailed Analysis of Candlestick Wicks in ICT
In ICT trading, long wicks are viewed as liquidity pools. The main types include:
- Long Upper Wick
- Reveals liquidity above the candle.
- Indicates activation of sell orders and strong seller presence.
- Long Lower Wick
- Reflects liquidity below the candle.
- Indicates absorption of buy orders, showing strong buyer intervention.
These wicks are often targeted within liquidity-based trading strategies.
Key Considerations for Wick Analysis in ICT
Through ICT principles:
- Wicks are treated as liquidity clusters with hidden institutional activity.
- They aid in identifying significant active liquidity zones.
- They enhance predictions of price direction based on pending orders and market structure.
Such analysis is vital for understanding order flow and formulating strategic entry and exit points.
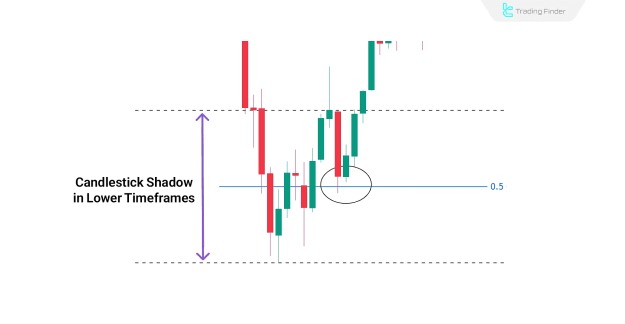
Reaction to the 50% Wick Level in ICT
The midpoint (50% level) of a wick serves as a dynamic zone of support or resistance:
- When price reacts precisely at the 50% level, it confirms the market’s intention to continue in that direction.
- If price reacts before reaching the 50% level, it reflects intense liquidity strength, increasing confidence in the prevailing movement.
Market Response to the 50% Wick Level
For example:
- A long wick forms.
- Subsequent candles react near the midpoint.
- This validates market intent and signals a probable directional move.
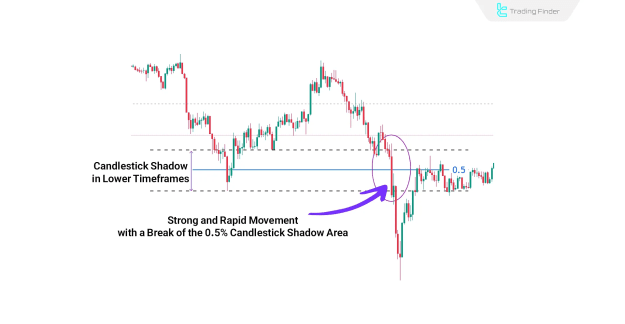
Ignoring the 50% Wick Level
Occasionally, the market:
- Rapidly returns to the 50% wick area and breaks it.
- Closes candles below this level on lower timeframes.
This scenario is interpreted as a structural break, signifying a possible continuation in the opposite direction.
Important Factors in This Analysis:
- The manner in which price returns to the level;
- Candlestick patterns formed around the midpoint;
- Closing positions relative to the wick zone.
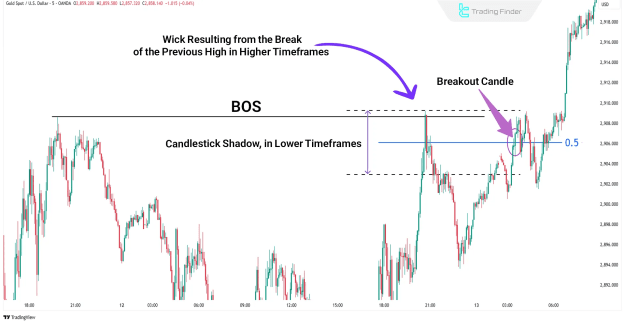
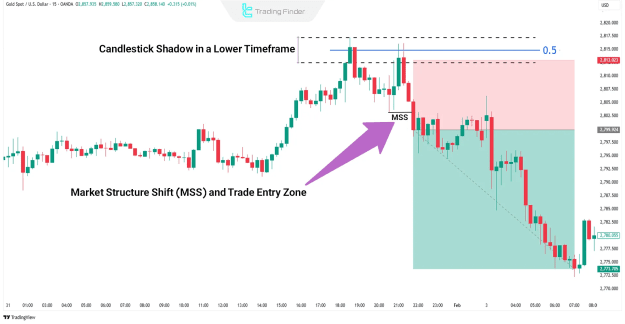
Confirming Entries at Mid-Wick Levels
A mere reaction to the 50% wick is insufficient for entry. Structural confirmation is essential, involving:
- A Break of Structure (BOS) aligned with the market trend.
- Entry triggered by this structural break.
- Stop Loss placed behind the new high or low formed during a return to a Fair Value Gap (FVG), or behind the FVG itself.
This strategy integrates:
- Liquidity concepts;
- Market structure analysis;
- Imbalance zone identification for optimal trade setups.
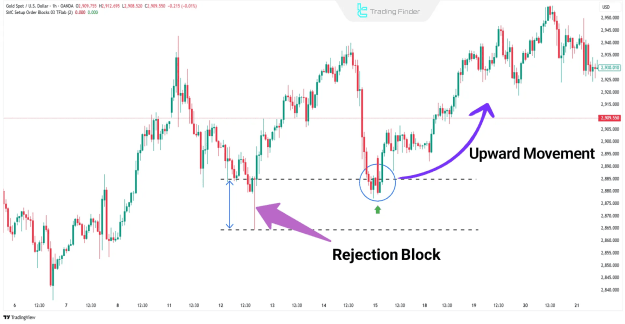
Candlestick Wicks as Rejection Blocks in ICT
In ICT trading, wicks can act as Rejection Blocks, representing zones where institutional orders have enforced significant buying or selling pressure. Characteristics include:
- Formation as long or medium-sized wicks;
- Sharp price rejections signalling hidden liquidity or institutional intervention.
These areas frequently precede major market movements and are treated as prime reversal or continuation zones for optimal entries and exits.
Important Points When Trading Using Candlestick Wicks in ICT
Key considerations include:
- Wick Length: Longer wicks indicate stronger market reactions and institutional liquidity involvement.
- Location within Structure: Wick formations at structural highs or lows strengthen analysis accuracy.
- Associated Candlestick Patterns: Patterns at wick areas provide behavioural confirmations necessary for high-probability decisions.
Conclusion
Candlestick wicks, or shadows, illustrate crucial market levels and liquidity interactions in ICT trading. Their size often correlates with the strength of underlying market zones:
- Long wicks frequently signal liquidity zones, Order Blocks, or Rejection Blocks.
- They serve as reliable indicators for probable reversals or trend continuations within the ICT framework.