TP & SL Tool: Risk Reward Ratio Calculator RRR MT5 | Prop Firm Protector: Trade Assist Prop Firm Plus TF Expert MT5 | Money Management + DrawDown Protector: Trade Panel Prop Firm Drawdawn Limiter Pro MT5 |Get a free Expert Advisor license via Telegram and WhatsApp
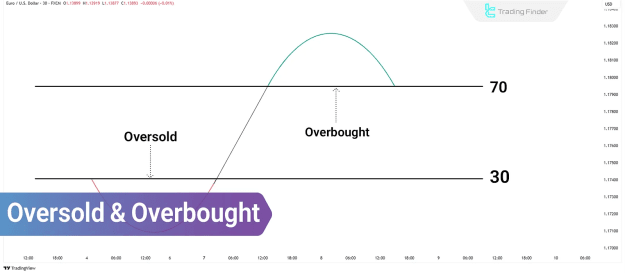
What Are Overbought and Oversold Conditions?
Overbought conditions emerge when an asset's price experiences a sustained upward trajectory, reaching levels that many traders and analysts deem excessively high. This often signals the potential conclusion of a bullish trend or the onset of a price correction. Conversely, oversold conditions describe a scenario where an asset's price has undergone a substantial decline, leading to it being considered undervalued. This typically suggests a weakening downtrend and the possibility of a bullish reversal.
Why Overbought/Oversold Matters
Financial markets rarely remain in perfect equilibrium. Factors like short-term trader sentiment, breaking news, central bank policies, and broader market psychology can push prices away from their intrinsic value. Identifying overbought/oversold conditions is crucial for traders for several key reasons:
- Risk Mitigation: It helps traders avoid initiating positions when sharp reversals or corrections are highly probable.
- Timing Entry/Exit: These conditions provide insights into when a correction or trend reversal might commence.
- Sentiment Analysis: Understanding these zones aids in gauging overall market sentiment, thereby helping traders avoid emotional decision-making.
Tools for Identifying Overbought and Oversold Zones
Various technical analysis tools have been developed to pinpoint these extreme market conditions. The most commonly employed include:
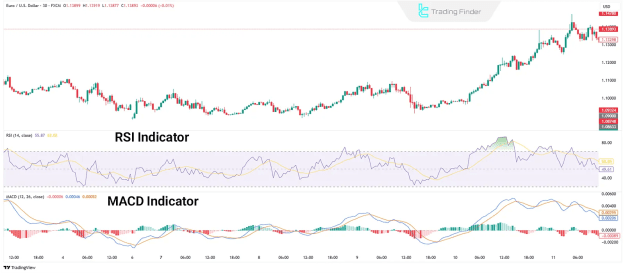
- Relative Strength Index (RSI): The RSI is a leading indicator for identifying overbought and oversold zones. Typically, an RSI reading above 70 indicates overbought conditions, while a reading below 30 suggests oversold conditions.
- Stochastic Oscillator: This indicator compares a specific closing price of an asset to its price range over a period of time. Levels above 80 signify overbought conditions, whereas levels below 20 indicate oversold conditions.
- Bollinger Bands: When an asset's price consistently moves beyond the upper or lower Bollinger Bands, it signals excessive buying or selling pressure, respectively.
- MACD and Divergences: A divergence between the price action and the MACD indicator line can serve as an early warning of trend exhaustion and a potential reversal from overbought or oversold states.
Correction vs. Reversal in Overbought/Oversold Conditions
It is crucial to understand that an overbought or oversold signal does not unequivocally guarantee a full trend reversal. In instances of exceptionally strong trends, the price may continue its trajectory despite reaching extreme levels. In such scenarios, the outcome is often a temporary price correction rather than a complete reversal.
To enhance the reliability of these signals, it is advisable to combine them with additional confirmations, such as:
- Divergences
- Candlestick patterns
- Static or dynamic support and resistance levels
- Volume analysis
Trading Using Overbought and Oversold Conditions
Two primary approaches for trading overbought and oversold conditions are counter-trend trading and trend continuation after correction.
Counter-Trend Trading in Overbought/Oversold Zones
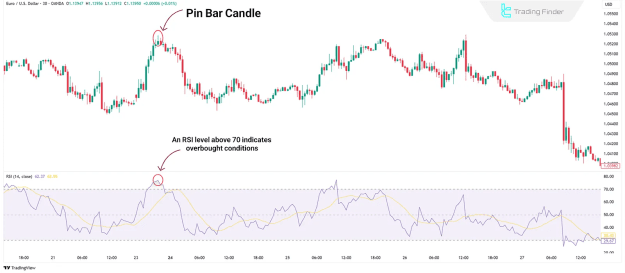
This strategy involves trading against the prevailing trend when overbought or oversold signals emerge. For instance, on a 30-minute EUR/USD chart, the appearance of a bearish pin bar near a resistance zone, characterized by a long upper wick and small body, suggests strong selling pressure. If this coincides with the RSI crossing above 70 (indicating overbought conditions), it collectively points to a potential downward reversal.
Trend Continuation After Correction from Overbought/Oversold
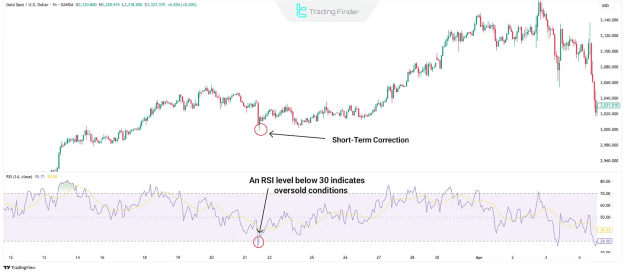
This approach focuses on identifying temporary corrections within a broader trend and re-entering the trend once the correction subsides. For example, on a 1-hour XAU/USD (Gold) chart, if the RSI drops below 30, indicating oversold conditions, this can be interpreted as a short-term correction within an existing uptrend. If the price subsequently resumes its upward momentum, it signals the conclusion of the correction phase and the continuation of the bullish trend.
Conclusion
Overbought and oversold conditions are critical market states that reflect a price's deviation from an asset's fair value. They serve as indicators of potential areas where corrections or trend reversals may occur. While technical indicators like RSI, Stochastic, Bollinger Bands, and MACD employ distinct methodologies for detecting these extremes, relying on them in isolation is often insufficient. Effective trading strategies involve combining these signals with other forms of technical analysis for confirmation and increased reliability.