TP & SL Tool: Risk Reward Ratio Calculator RRR MT5 | Prop Firm Protector: Trade Assist Prop Firm Plus TF Expert MT5 | Money Management + DrawDown Protector: Trade Panel Prop Firm Drawdawn Limiter Pro MT5 |Get a free Expert Advisor license via Telegram and WhatsApp
What Are Fibonacci Levels?
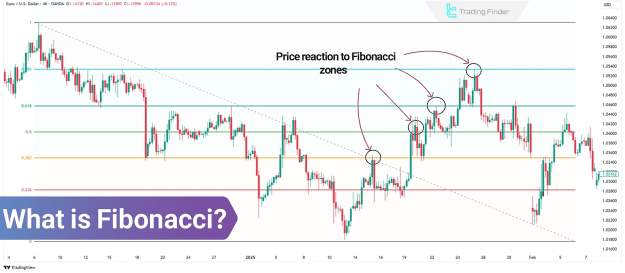
Fibonacci in financial markets refers to a set of mathematical ratios derived from the Fibonacci sequence. These ratios are plotted as horizontal lines on price charts to identify support, resistance, and potential reversal zones.
Traders use Fibonacci tools to:
- Determine key support and resistance levels
- Set price targets in trending markets
- Identify pullback and continuation zones
- Enhance risk management strategies
History of Fibonacci in Trading
The Fibonacci sequence was introduced by Italian mathematician Leonardo Fibonacci in the 13th century. Each number in the sequence is the sum of the two preceding numbers (0, 1, 1, 2, 3, 5, 8, 13, ...).
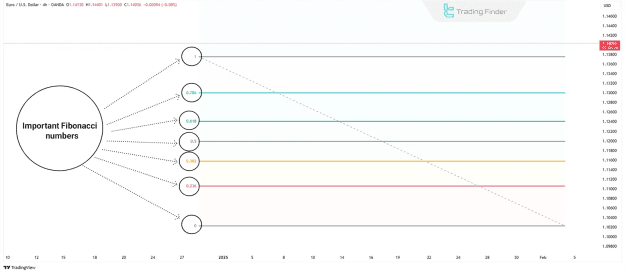
The key Fibonacci ratios used in trading include:
- 23.6%
- 38.2%
- 50% (not a true Fibonacci ratio but widely used)
- 61.8% (the Golden Ratio)
- 78.6%
These ratios help traders predict market behavior based on historical price reactions.
Why Do Prices React to Fibonacci Levels?
Since many traders and institutions follow Fibonacci levels, these zones often act as self-fulfilling prophecies. When price approaches a key Fibonacci level, increased buying or selling activity can lead to reversals or continuations.
However, Fibonacci levels should not be used in isolation—combining them with other technical tools increases accuracy.
Key Fibonacci Tools in Technical Analysis
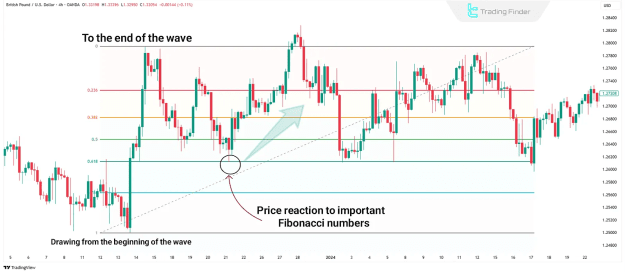
1. Fibonacci Retracement
Purpose: Identifies potential pullback levels after a price move.
How to Draw:
- Select a swing low and swing high in an uptrend (or vice versa in a downtrend).
- The tool automatically plots retracement levels (23.6%, 38.2%, 50%, 61.8%, 78.6%).
Usage:
- Look for price reactions at these levels to enter trades in the trend’s direction.
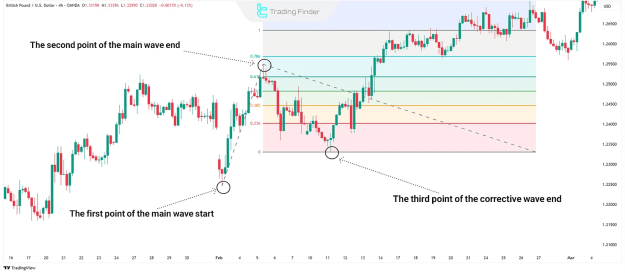
2. Fibonacci Extension
Purpose: Projects potential price targets after a trend continuation.
How to Draw:
- Mark three points: start of the trend, end of the trend, and end of the pullback.
- The tool displays extension levels (127.2%, 161.8%, 261.8%, 423.6%).
Usage:
- Use these levels as profit-taking zones or areas where trends may reverse.
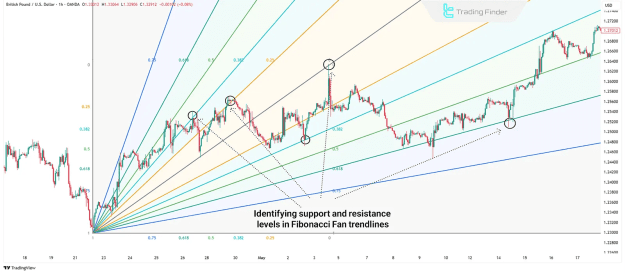
3. Fibonacci Fan
Purpose: Identifies dynamic support and resistance using diagonal lines.
How to Draw:
- Connect a swing low to a swing high (or vice versa).
- The tool draws trendlines based on Fibonacci ratios.
Usage:
- Watch for price reactions near these lines to confirm trend strength.
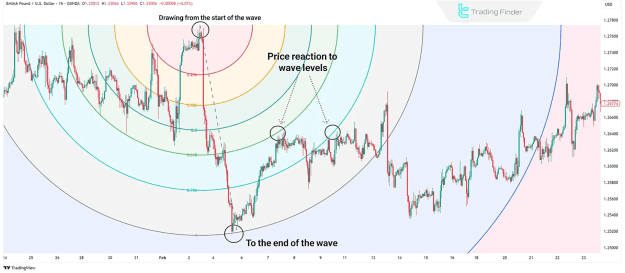
4. Fibonacci Arc
Purpose: Combines price and time to forecast reversal zones.
How to Draw:
- Select a swing low and swing high.
- The tool plots curved arcs intersecting potential support/resistance areas.
Usage:
- Useful for identifying turning points in trending markets.
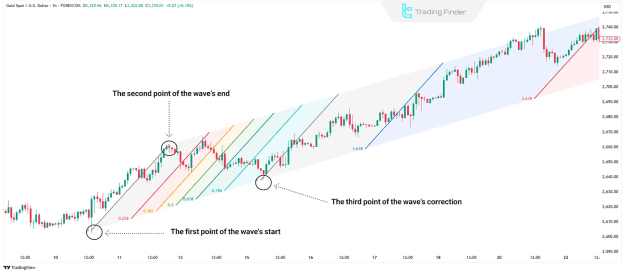
5. Fibonacci Channel
Purpose: Helps track price movements within a trend using parallel lines.
How to Draw:
- Select three points (two highs and one low, or two lows and one high).
- The tool draws Fibonacci-based parallel channels.
Usage:
- Trade bounces within the channel or breakouts beyond it.
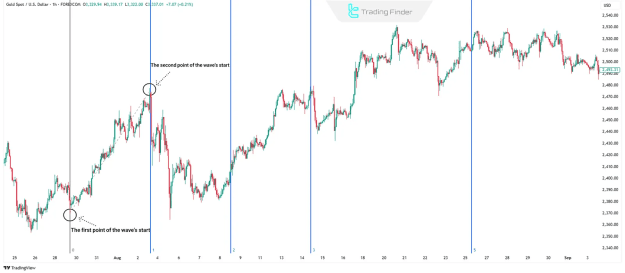
6. Fibonacci Time Zones
Purpose: Predicts potential trend changes based on time cycles.
How to Draw:
- Mark a significant price high or low.
- The tool draws vertical lines based on Fibonacci numbers (1, 2, 3, 5, 8, 13...).
Usage:
- Helps anticipate trend reversals or accelerations at key time intervals.
Enhancing Fibonacci Analysis
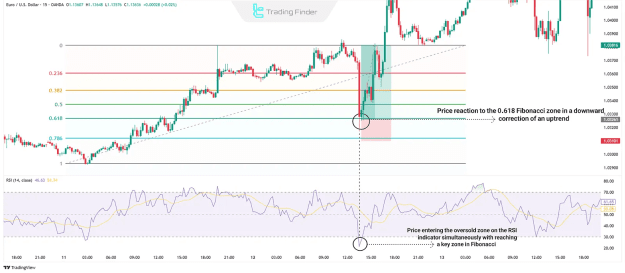
Combining Fibonacci with RSI
- When price reaches a Fibonacci level and RSI is overbought or oversold, reversal probability increases.
- Example: A pullback to 61.8% retracement with RSI below 30 suggests a potential long entry.
Fibonacci and Price Action
- Look for candlestick patterns (engulfing, pin bars) at Fibonacci levels.
- Example: A bullish engulfing at 38.2% retracement confirms a buy signal.
Multi-Timeframe Fibonacci Analysis
- Draw Fibonacci levels on higher timeframes (daily/weekly) for major support/resistance.
- Use lower timeframes (1H/4H) for precise entry/exit points.
Common Fibonacci Trading Mistakes
- Incorrect swing point selection – Always use clear highs and lows.
- Ignoring confirmations – Combine with other indicators (RSI, MACD).
- Over-reliance on Fibonacci – Market sentiment and news also matter.
- Using Fibonacci in choppy markets – Best applied in strong trends.
Conclusion
Fibonacci tools remain a cornerstone of technical analysis due to their accuracy and adaptability. By combining them with price action, indicators, and multi-timeframe analysis, traders can improve their market timing and risk management.
For best results:
![]() Use Fibonacci in clear trends.
Use Fibonacci in clear trends.
![]() Look for Fibonacci clusters (multiple levels converging).
Look for Fibonacci clusters (multiple levels converging).
![]() Always wait for confirmation signals before trading.
Always wait for confirmation signals before trading.
Mastering Fibonacci analysis can significantly enhance a trader’s ability to predict market movements and optimize trading strategies.