TP & SL Tool: Risk Reward Ratio Calculator RRR MT4 | Prop Firm Protector: Trade Assist Prop Firm Plus TF Expert MT4 | Money Management + DrawDown Protector: Trade Panel Prop Firm Drawdawn Limiter Pro MT4 |Get a free Expert Advisor license via Telegram and WhatsApp
What Is the MACD Indicator?
The MACD indicator calculates the difference between two EMAs to measure price momentum. This tool generates multiple trading signals and is a key element in many technical analysis strategies across different market conditions.
Key Functions of the MACD:
- Detects overall trend direction
- Measures price momentum shifts
- Highlights divergence and convergence patterns
- Provides entry and exit signals through crossovers
Types of MACD Indicators
Various enhanced versions of the MACD indicator have been developed to improve signal quality and trading accuracy. These versions may include:
- Smart MACD indicators with automated divergence detection
- MACD combined with other indicators for advanced signal confirmation
- Noise-filtered MACD versions for better performance in volatile markets
Advantages and Disadvantages of MACD
While the MACD offers powerful insights into trend direction and momentum, it is based on historical data, which can cause signal delays. Traders should be aware of its strengths and limitations.
Advantages:
- Effective in identifying strong trends
- Can be combined with other technical indicators
- Helpful in spotting divergence patterns
- Simple to interpret and apply across markets
Disadvantages:
- Lagging signals due to reliance on moving averages
- Susceptible to false signals in ranging markets
- Requires additional confirmation in some scenarios
- Performance depends on correct settings
Components of the MACD Indicator
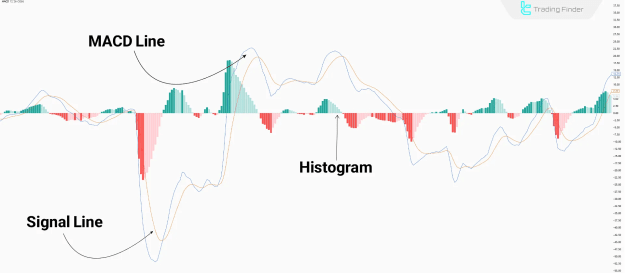
The MACD indicator is composed of three key elements, each contributing to momentum analysis and trend evaluation.
MACD Line
- Represents the difference between two EMAs
- An upward slope suggests bullish momentum
- A downward slope indicates bearish momentum
- Slope angle reflects the strength of momentum
Signal Line
- A 9-period EMA of the MACD Line
- Helps smooth out fluctuations and reduce false signals
- Crossover with the MACD Line generates common buy/sell signals
Histogram
- Shows the distance between the MACD Line and the Signal Line
- Visualized as vertical bars on the chart
- Indicates the strength and direction of momentum
MACD Settings for Different Trading Styles
The MACD indicator offers customizable settings suitable for various trading strategies across different timeframes.
For Short-Term Trading:
- High sensitivity
- Suggested EMA settings: (5,13,16)
- Signal line: EMA (5)
- Timeframe: 1 to 15 minutes
For Medium-Term Trading:
- Balanced sensitivity and accuracy
- Suggested EMA settings: (5,21,8)
- Signal line: EMA (5)
- Timeframe: 15 minutes to 1 hour
For Long-Term Trading:
- High signal reliability
- Standard EMA settings: (12,26,9)
- Signal line: EMA (9)
- Timeframe: 4H to Daily
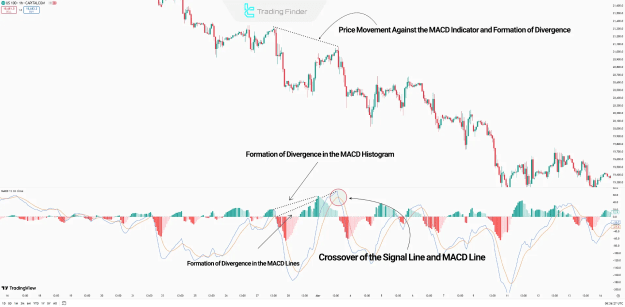
Example of MACD in Action
In a 1-hour chart of the Nasdaq Index (US100), the price forms a lower high, while the MACD forms a higher high. This divergence indicates a potential reversal. A downward crossover of the MACD Line and Signal Line confirms the bearish shift, followed by an actual drop in price.
Comparison Between MACD and RSI Indicators
Both the MACD and RSI are momentum indicators, yet they differ in structure and signal interpretation.
Key Differences:
- MACD combines trend-following and momentum features
- RSI is a pure oscillator used to identify overbought and oversold conditions
- MACD is more effective in trending markets
- RSI performs better in ranging markets
- MACD uses EMAs and crossovers for signals
- RSI operates on a fixed range from 0 to 100
Conclusion
The MACD indicator is a powerful technical tool that analyzes momentum using the MACD Line, Signal Line, and Histogram. Its effectiveness increases when divergence patterns are clearly established. Due to its flexible settings, the MACD can be tailored for short-term scalping, medium-term swing trading, and long-term position trading. When combined with other tools, such as RSI and AO, its utility in a comprehensive trading strategy is further enhanced.