For improved trading accuracy, it is recommended to combine Bollinger Bands with other technical indicators or volatility tools.
It is widely recommended in forex education to use Bollinger Bands alongside other technical indicators or volatility tools to enhance trading signal accuracy.
TP & SL Tool: Risk Reward Ratio Calculator RRR MT4 | Prop Firm Protector: Trade Assist Prop Firm Plus TF Expert MT4 | Money Management + DrawDown Protector: Trade Panel Prop Firm Drawdawn Limiter Pro MT4 |Get a free Expert Advisor license via Telegram and WhatsApp
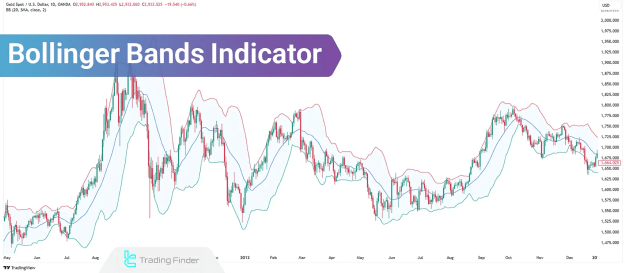
What Are Bollinger Bands?
Developed by John Bollinger in the 1980s, Bollinger Bands are designed to dynamically establish price boundaries, assisting traders in determining overbought and oversold market conditions. By analysing bandwidth and price positioning relative to the bands, traders can assess whether a trend is likely to continue or reverse.
The adaptability of Bollinger Bands makes them effective across varying market environments, particularly when paired with complementary indicators.
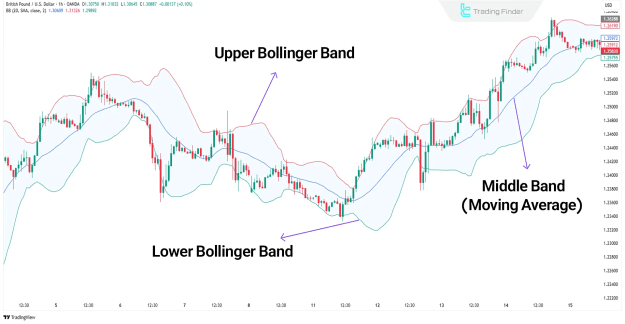
Components of Bollinger Bands
Bollinger Bands comprise three primary components essential for price analysis:
- Middle Band: 20-period simple moving average
- Upper Band: Calculated as the middle band plus two standard deviations
- Lower Band: Calculated as the middle band minus two standard deviations
Advantages and Limitations of Bollinger Bands
Like all technical tools, Bollinger Bands present specific benefits and limitations:
Advantages
- Effectively measures market volatility
- Simple to implement and interpret
- Identifies overbought and oversold market conditions
- Defines the price fluctuation range
Limitations
- Requires other indicators for signal confirmation
- Not designed for market forecasting
- Needs accurate configuration to avoid misleading signals
- May generate false signals during periods of high volatility
Using Bollinger Bands to Analyse Trends
The response of Bollinger Bands to price movements provides critical insights into market trends:
- Band Expansion: Indicates increasing volatility, often marking the beginning of a strong upward or downward trend
- Band Contraction: Reflects decreasing volatility, suggesting a possible shift into a sideways market
Analysing these expansions and contractions is vital for identifying significant price movements.
Measuring Market Volatility with Bollinger Bands
The distance between the upper and lower bands reflects the level of market volatility:
- Narrowing Bands: Indicate reduced volatility and tight price action, which can precede strong market breakouts
- Widening Bands: Suggest increased volatility, often signalling the start of a new trend and potential trading opportunities
Monitoring these bandwidth shifts provides traders with early signals of possible market changes.
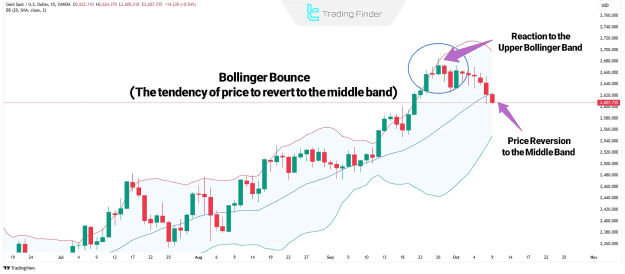
What Is a Bollinger Bounce?
In the context of Bollinger Bands, price often reverts towards the middle band, which acts as dynamic support or resistance. When the price moves significantly towards an outer band and returns to the middle band, this behaviour is known as a Bollinger Bounce.
Trading Strategies Using Bollinger Bands
To maximise the effectiveness of Bollinger Bands, traders employ various strategies based on price behaviour near the bands:
- Walking the Band Strategy
- Double Top or Bottom Strategy
- Reversal Patterns within the Bands
- Band Squeeze Breakout Strategy
- Middle Band Range Trading Strategy
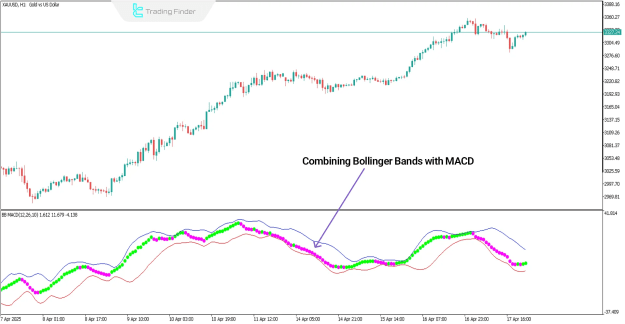
Combining Bollinger Bands with MACD
Integrating Bollinger Bands with the MACD indicator enhances trend and momentum analysis. The MACD comprises the MACD Line, Signal Line, and Histogram; however, only the first two are required for this strategy.
This combination allows traders to identify trend reversals and optimise entry and exit points with greater precision.
Trading with the Bollinger Bands and MACD Combination
When price reaches overbought or oversold areas indicated by Bollinger Bands, traders utilise MACD signals for confirmation:
- Oversold Zone (Lower Band): MACD lines below zero validate potential buy entries
- Overbought Zone (Upper Band): MACD lines above zero confirm bearish market momentum
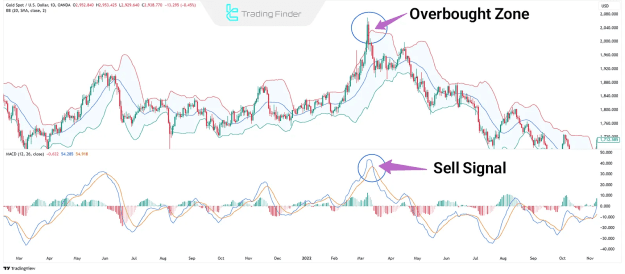
Bollinger Bands and MACD Sell Setup
- Price reaches the upper Bollinger Band, indicating overbought conditions
- MACD confirms a sell signal with lines positioned above zero
This setup helps filter out false trading signals, focusing only on valid opportunities.
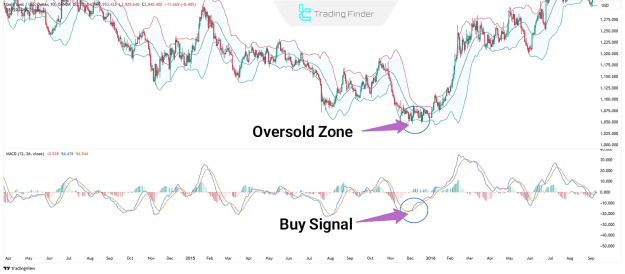
Bollinger Bands and MACD Buy Setup
- Price touches the lower Bollinger Band, indicating oversold conditions
- MACD confirms a buy signal with lines positioned below zero
Conclusion
The Bollinger Bands indicator remains an essential tool in technical analysis, providing critical insights into market volatility, trend direction, and key price levels. By integrating standard deviation and simple moving averages, Bollinger Bands effectively identify overbought or oversold market conditions and potential breakout scenarios.
When combined with indicators such as MACD, Bollinger Bands enhance the accuracy of trading decisions, especially during periods of high volatility or market consolidation.