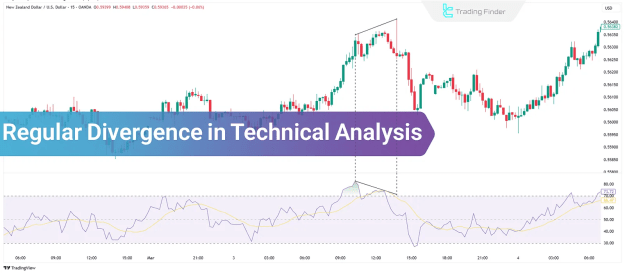
This phenomenon indicates a weakening of the prevailing trend and often acts as an early warning for a possible reversal in market direction, making it a valuable concept in forex education.
TP & SL Tool: Risk Reward Ratio Calculator RRR MT5 | Prop Firm Protector: Trade Assist Prop Firm Plus TF Expert MT5 | Money Management + DrawDown Protector: Trade Panel Prop Firm Drawdawn Limiter Pro MT5 |Get a free Expert Advisor license via Telegram and WhatsApp
Types of Regular Divergence
Classification
Regular Divergence can be categorized into two primary types:
- Bullish Regular Divergence
- Bearish Regular Divergence
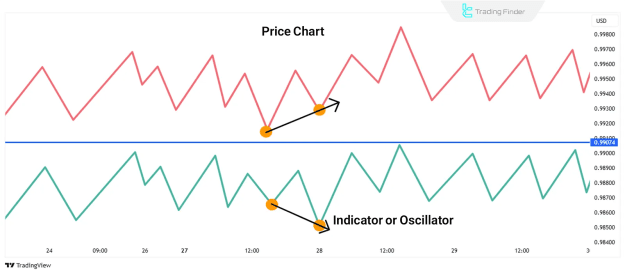
Bullish Regular Divergence
Bullish Regular Divergence arises when the price action records a series of lower lows, while the corresponding technical indicator forms higher lows. This divergence generally occurs towards the end of a downtrend and suggests the following:
- The prevailing downtrend is losing momentum.
- There is an increased likelihood of an upcoming upward reversal in price.
For example:
- If the price of an asset forms a new low, but the indicator fails to register a lower low, it reflects weakening selling pressure, thereby increasing the potential for price appreciation.
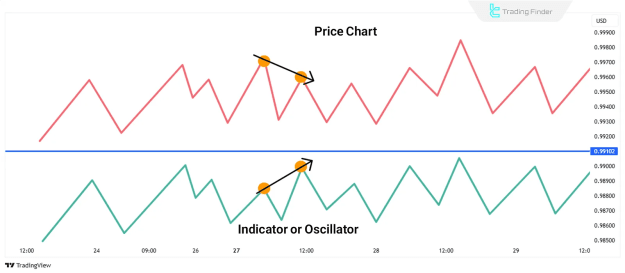
Bearish Regular Divergence
Bearish Regular Divergence occurs when the price records higher highs, but the indicator forms lower highs. This type of divergence is commonly observed towards the end of an uptrend and indicates:
- A reduction in buying strength within the market.
- A potential reversal towards a downward correction.
For example:
- If the price continues to make higher highs while the indicator fails to surpass previous highs, it suggests a weakening bullish trend and a likely market reversal.
Applying Regular Divergence in Trading
Utilizing regular divergence in trading strategies enhances the accuracy of market reversal identification. The process involves:
- Employing indicators such as:
- RSI (Relative Strength Index)
- MACD (Moving Average Convergence Divergence)
- Stochastic Oscillator
- CCI (Commodity Channel Index)
- Confirming divergence signals through additional technical analysis tools, including:
- Support and resistance levels
- Established trendlines
- Candlestick pattern analysis
This comprehensive approach assists traders in determining optimal entry and exit points, thereby minimizing trading risks and enhancing profitability.
Regular Divergence vs. Hidden Divergence
Understanding the distinction between regular divergence and hidden divergence is crucial for technical analysts:
- Regular Divergence
- Occurs when the price action and indicator move in opposing directions.
- Signals a potential trend reversal, marking the end of the current trend.
- Hidden Divergence
- Occurs when the price forms a higher high or lower low, but the indicator does not mirror this movement.
- Indicates trend continuation, serving as confirmation of the existing market trend.
Conclusion
Regular Divergence remains a vital tool within technical analysis for identifying potential trend reversals in forex, commodities, and broader financial markets. It reflects a divergence between price action and technical indicators, signaling a possible market shift.
- In bullish regular divergence, lower lows in price coupled with higher lows in indicators suggest a potential upward reversal.
- In bearish regular divergence, higher highs in price with lower highs in indicators indicate a probable downward correction.
Incorporating regular divergence analysis alongside other technical tools strengthens trading strategies and supports more informed decision-making within dynamic market environments.