TP & SL Tool: Risk Reward Ratio Calculator RRR MT5 | Prop Firm Protector: Trade Assist Prop Firm Plus TF Expert MT5 | Money Management + DrawDown Protector: Trade Panel Prop Firm Drawdawn Limiter Pro MT5 |Get a free Expert Advisor license via Telegram and WhatsApp
What Are Support and Resistance Levels?
- Support is a price level where a downtrend may pause due to increased buying demand, preventing further decline.
- Resistance is a price level where an uptrend may stall or reverse as selling pressure overcomes buying interest.
Types of Support and Resistance
Support and resistance are not static—they manifest in different forms depending on market conditions.
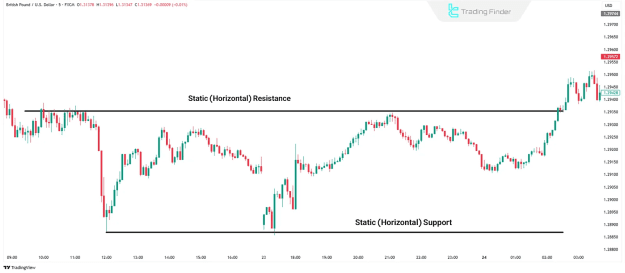
1. Static (Horizontal) Support and Resistance
When price repeatedly reacts at a specific level, it forms horizontal support or resistance. These levels are plotted as straight lines on a chart and indicate strong market reactions.
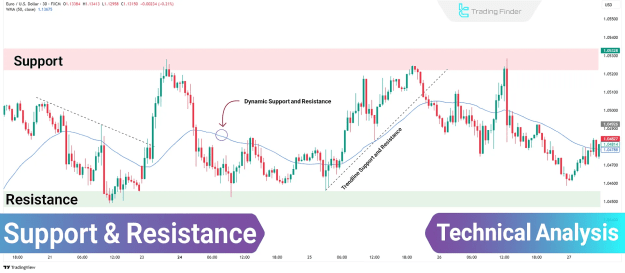
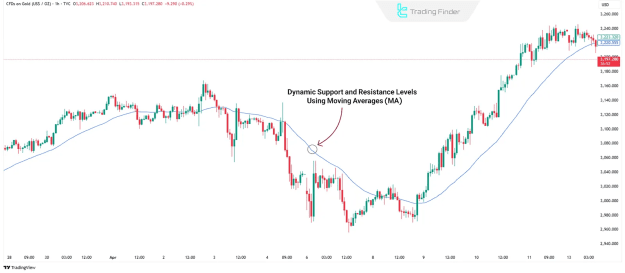
2. Dynamic Support and Resistance
Dynamic levels adjust with price movements and are often identified using technical tools like:
- Moving Averages (e.g., MA50, MA200)
- Trendlines
These are particularly useful in trending markets.
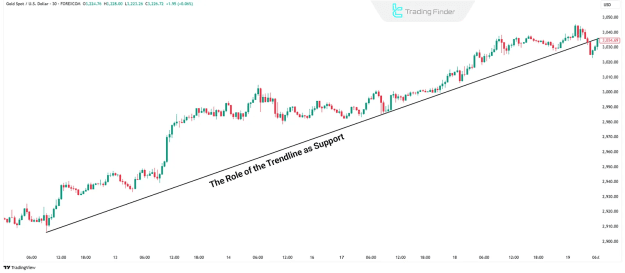
3. Trendline-Based Support and Resistance
In an uptrend, the trendline beneath price acts as support, while in a downtrend, the trendline above price serves as resistance.
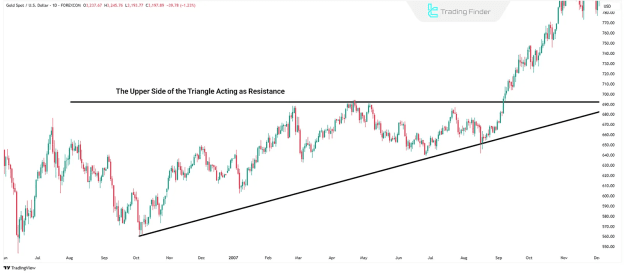
4. Pattern-Based Support and Resistance
Classic chart patterns such as:
- Triangles (ascending, descending, symmetrical)
- Channels
- Flags and pennants
generate support and resistance zones. For example, the upper boundary of an ascending triangle often acts as resistance.
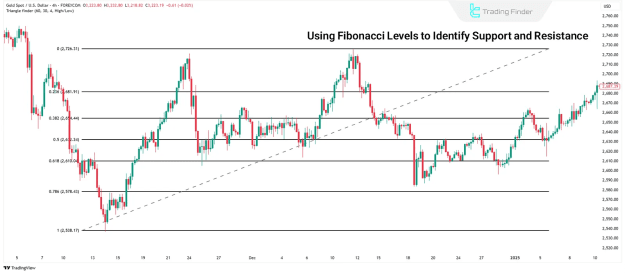
5. Fibonacci Retracement Levels
Key Fibonacci levels (38.2%, 50%, 61.8%) frequently act as support or resistance, helping traders identify potential reversal zones.
6. Psychological Support and Resistance
Round numbers (e.g., 1.3000 in Forex, $70,000 in Bitcoin) attract significant trading activity due to their psychological impact on market participants.
Role Reversal: Support Turns into Resistance (and Vice Versa)
A critical principle in technical analysis is the role reversal of support and resistance:
- If price breaks below support, that level often becomes resistance.
- If price breaks above resistance, it may later act as support.
The more times a level is tested, the stronger its significance becomes.
Trading Strategies Using Support and Resistance
1. Reversal Entry Strategy
Traders enter positions when price approaches support or resistance and shows reversal signals (e.g., candlestick patterns, RSI divergence). Stop-loss orders are placed just beyond the reaction level.
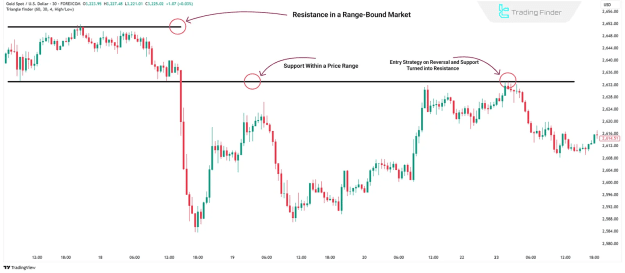
2. Range Trading Strategy
In sideways markets, traders buy near support and sell near resistance until a breakout occurs.
3. Breakout Strategy
When price breaches a key support or resistance level with strong momentum (confirmed by volume), traders enter in the breakout direction. A pullback to the broken level often provides a secondary entry opportunity.
Conclusion
Support and resistance levels are essential for predicting market behavior. They help traders identify potential trend reversals, breakouts, and consolidation zones. By mastering these concepts, traders can enhance their decision-making and improve risk management.
Understanding how these levels function—whether static, dynamic, or psychological—enables traders to develop robust strategies for various market conditions.