TP & SL Tool: Risk Reward Ratio Calculator RRR MT4 | Prop Firm Protector: Trade Assist Prop Firm Plus TF Expert MT4 | Money Management + DrawDown Protector: Trade Panel Prop Firm Drawdawn Limiter Pro MT4 |Get a free Expert Advisor license via Telegram and WhatsApp
Keltner Channel Indicators:
Keltner Channel Indicator MT4
Keltner Channel Indicator MT5
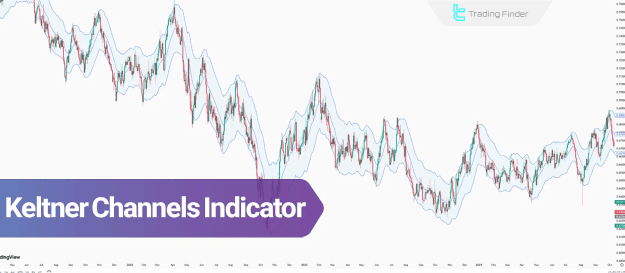
Introduction to the Keltner Channels Indicator
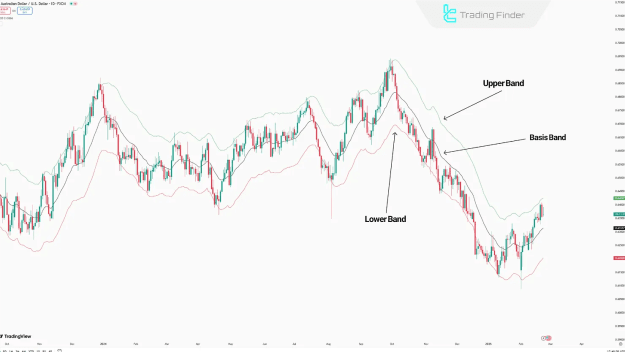
The Keltner Channels are constructed using the Exponential Moving Average (EMA) and the Average True Range (ATR), forming a price envelope that reflects both trend and volatility.
The indicator comprises the following components:
- Middle Line (Basis Line): Represents the 20-period EMA and shows the prevailing market trend.
- Upper Line (Upper Band): Acts as dynamic resistance. A price breakout above this line typically signals a bullish momentum.
- Lower Line (Lower Band): Serves as dynamic support. A price drop below this line usually indicates bearish momentum.
Advantages and Disadvantages of the Keltner Channels
Before incorporating the Keltner Channels technical indicator into trading strategies, it is crucial to assess its key advantages and limitations.
Advantages
- Integrates trend-following (EMA) and volatility (ATR) elements for precise signal generation.
- Offers greater stability than Bollinger Bands in high-volatility conditions.
- Efficient in identifying strong trends and marking entry and exit points.
- Helps reduce market noise, enhancing clarity in price movement analysis.
Disadvantages
- Performs poorly in range-bound or low-volatility market environments.
- Requires proper parameter calibration for optimal accuracy.
- Less effective at identifying overbought and oversold levels.
- May react slowly to sudden price shifts.
Applications of the Keltner Channels
The indicator’s combination of EMA and ATR makes it suitable for multiple trading purposes including trend detection, breakout signals, and entry/exit decisions.
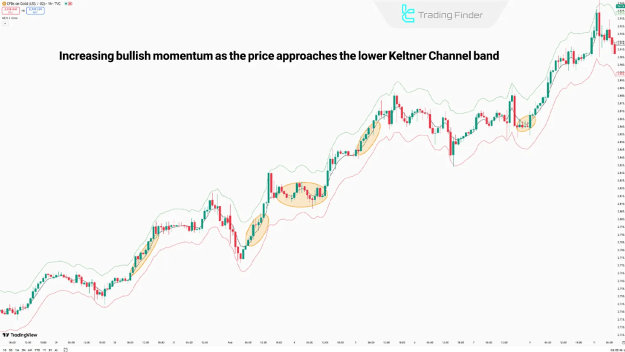
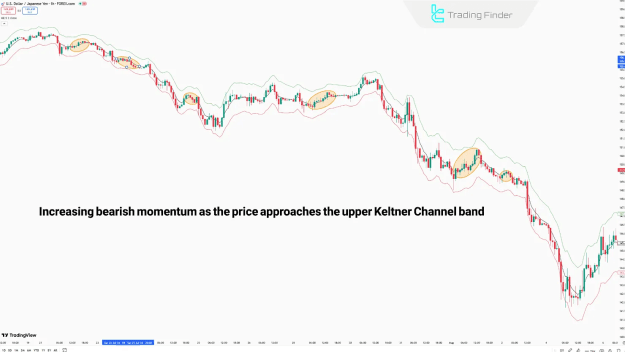
Using the Keltner Channels to Identify Trends
The position of the price in relation to the three bands determines the market trend:
- Uptrend: When price remains between the Basis Line and Upper Band, with the middle line functioning as dynamic support.
- Downtrend: When price moves between the Basis Line and Lower Band, using the middle line as dynamic resistance.
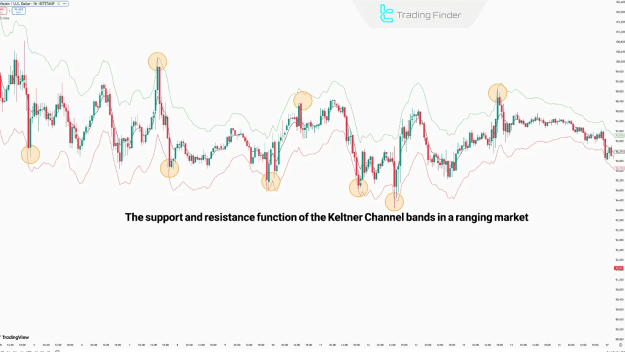
- Range-Bound Market: When price fluctuates within the bands and frequently crosses the middle line, indicating a lack of clear direction.
Tip: For easier implementation, the Keltner Channels can be accessed via the TradingFinder indicator package for both MT4 and MT5 platforms.
Receiving Breakout Signals Using the Keltner Channels
The indicator also helps detect potential breakout scenarios:
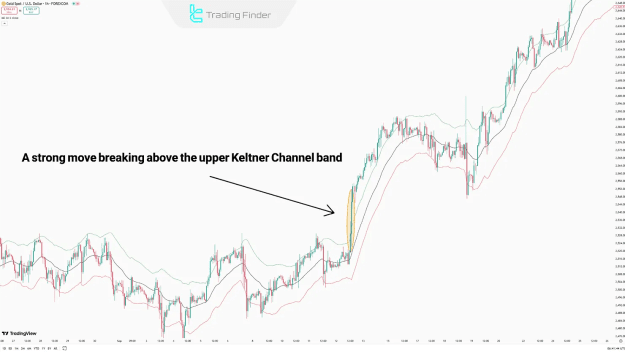
- Bullish Breakout: Occurs when price decisively breaks above the Upper Band, supported by strong bullish candles and increased volume.
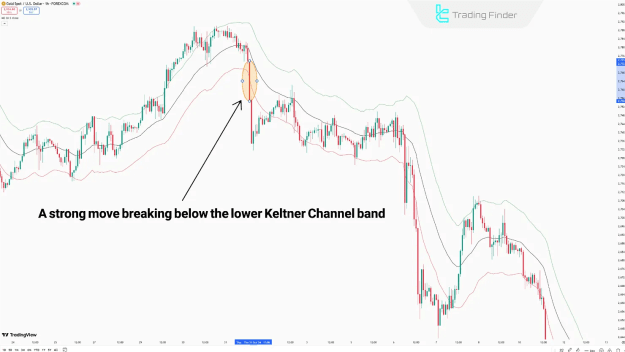
- Bearish Breakout: Confirmed when price breaks below the Lower Band with high-volume bearish candles.
Trading with the Keltner Channels Indicator
This indicator is effective in determining strategic entry points, stop-loss levels, and exit signals based on market behavior.
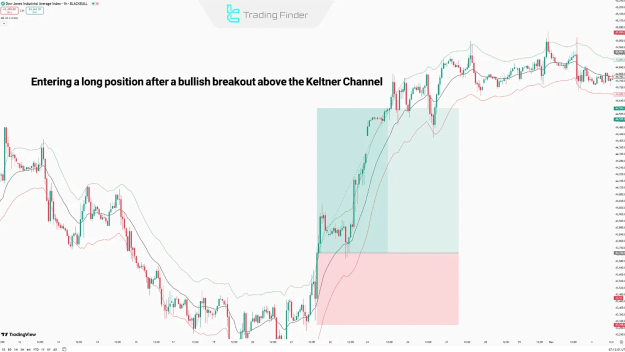
Long Position Strategy
- Entry: Initiated after a strong candle breaks above the Basis Line or Upper Band, accompanied by rising volume.
- Stop Loss: Positioned just below the Basis Line or Lower Band.
- Exit: Triggered when the price falls below the middle line or approaches the Lower Band.
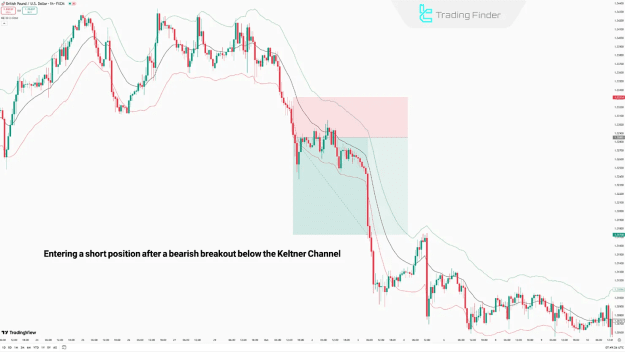
Short Position Strategy
- Entry: Begins when a strong bearish candle breaks below the Basis Line or Lower Band with elevated volume.
- Stop Loss: Placed above the Basis Line or Upper Band.
- Exit: Considered when price crosses above the middle line or nears the Upper Band.
Differences Between Keltner Channels and Bollinger Bands
Although visually similar, the Keltner Channels and Bollinger Bands differ significantly in their technical calculations and applications:
- Keltner Channels use the Exponential Moving Average (EMA) and Average True Range (ATR) for their structure.
- Bollinger Bands rely on the Simple Moving Average (SMA) and Standard Deviation.
- Bollinger Bands are more sensitive to volatility, while Keltner Channels offer greater consistency in volatile conditions.
- The primary use of Keltner Channels is to identify trend direction and breakout potential, whereas Bollinger Bands are more commonly applied to detect overbought/oversold zones.
Conclusion
The Keltner Channels indicator is a versatile tool suitable for short-term and long-term trading strategies. While it excels at highlighting strong trends and breakout points, it is less reliable in sideways or low-volatility markets. For optimal results, traders should consider combining it with volume-based indicators or momentum oscillators to validate signals and minimize false entries.