TP & SL Tool: Risk Reward Ratio Calculator RRR MT5 | Prop Firm Protector: Trade Assist Prop Firm Plus TF Expert MT5 | Money Management + DrawDown Protector: Trade Panel Prop Firm Drawdawn Limiter Pro MT5 |Get a free Expert Advisor license via Telegram and WhatsApp
Gartley Harmonic Pattern Indicator:
Gartley Harmonic Pattern MT4 Indicator
Gartley Harmonic Pattern MT5 Indicator
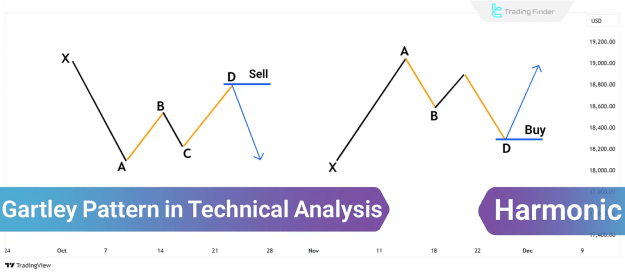
What is the Gartley Pattern?
The Gartley pattern, also known as the "222" pattern, combines the ABCD pattern with an additional pivot point (X). It typically forms during a trend correction, resembling an "M" in an uptrend or a "W" in a downtrend.
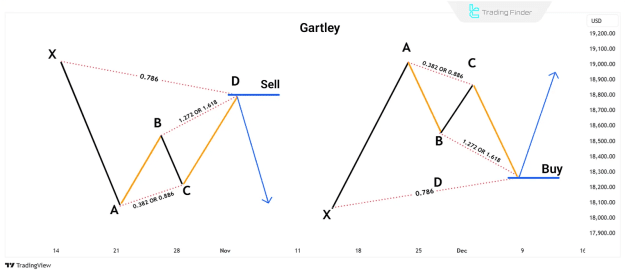
Key Fibonacci Ratios in the Gartley Pattern
- AB leg must retrace 61.8% of the XA leg.
- BC leg should retrace 38.2% or 88.6% of the AB leg.
- If BC = 38.2% of AB, then CD = 1.272 × BC.
- If BC = 88.6% of AB, then CD = 1.618 × BC.
- CD leg must retrace 78.6% of the XA leg.
How to Trade the Gartley Pattern?
To effectively trade the Gartley harmonic pattern, traders must wait for the structure to complete and confirm using Fibonacci levels and additional technical indicators.
Trading Strategy with the Gartley Pattern
- Entry Point: Enter at point D when a reversal signal appears (e.g., candlestick patterns, RSI divergence).
- Stop Loss: Place below point X for buy trades and above point X for sell trades.
- Take Profit: Initial target at point B, followed by point C.
Related Harmonic Patterns Derived from the Gartley Pattern
Several advanced harmonic patterns have evolved from the Gartley pattern, each with unique Fibonacci structures and trading applications.
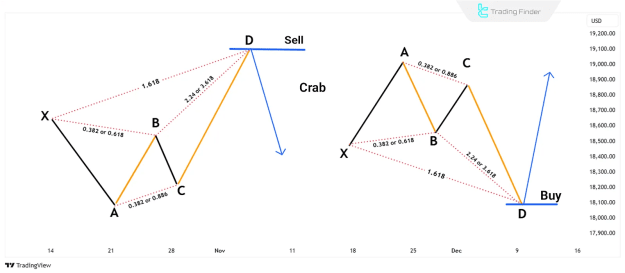
1. The Crab Pattern
Introduced by Scott M. Carney, the Crab pattern offers high precision in identifying reversals with extreme extensions.
Crab Pattern Structure
- AB = 38.2% or 61.8% of XA
- BC = 38.2% or 88.6% of AB
- If BC = 38.2% of AB, then CD = 2.24 × BC
- If BC = 88.6% of AB, then CD = 3.618 × BC
- CD = 1.618 extension of XA
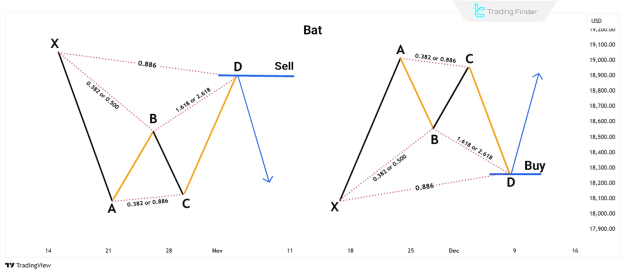
2. The Bat Pattern
The Bat pattern, another creation by Scott Carney, provides deeper retracements, making it ideal for volatile markets.
Bat Pattern Structure
- AB = 38.2% or 50% of XA
- BC = 38.2% or 88.6% of AB
- If BC = 38.2% of AB, then CD = 1.618 × BC
- If BC = 88.6% of AB, then CD = 2.618 × BC
- CD = 88.6% retracement of XA
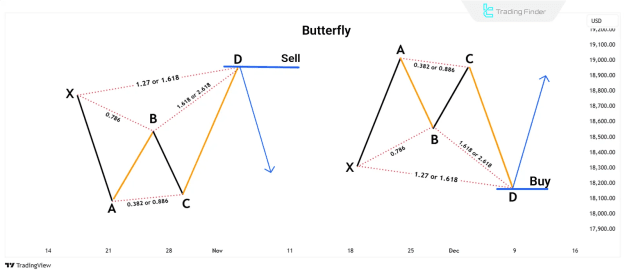
3. The Butterfly Pattern
Developed by Bryce Gilmore, the Butterfly pattern identifies reversals at extended price levels.
Butterfly Pattern Structure
- AB = 78.6% of XA
- BC = 38.2% or 88.6% of AB
- If BC = 38.2% of AB, then CD = 1.618 × BC
- If BC = 88.6% of AB, then CD = 2.618 × BC
- CD = 1.272 or 1.618 extension of XA
Pros and Cons of Harmonic Patterns
Gartley Pattern
![]() Reliable & widely used
Reliable & widely used
![]() Good risk-reward ratio
Good risk-reward ratio
![]() Requires experience for accurate identification
Requires experience for accurate identification
Crab Pattern
![]() Highly precise reversals
Highly precise reversals
![]() High profit potential
High profit potential
![]() Wider stop-loss needed
Wider stop-loss needed
Bat Pattern
![]() High success rate
High success rate
![]() Suitable for volatile markets
Suitable for volatile markets
![]() Complex identification
Complex identification
Butterfly Pattern
![]() Strong reversal signals
Strong reversal signals
![]() High profit potential
High profit potential
![]() Variable risk-reward ratio
Variable risk-reward ratio
Conclusion
The Gartley harmonic pattern remains one of the most effective tools for spotting trend reversals in Forex and cryptocurrency markets. Mastering its Fibonacci-based structure, along with related patterns like the Crab, Bat, and Butterfly, can significantly improve trading performance.
For optimal results, traders should combine harmonic patterns with additional technical analysis tools to confirm entries and exits.