This concept is widely applied across various financial markets, including stocks, cryptocurrencies, and especially the forex market, where it serves as a key tool for identifying trend continuation signals. As part of comprehensive Forex Education , understanding hidden divergence equips traders with valuable skills to analyze market momentum and make informed trading decisions.
TP & SL Tool: Risk Reward Ratio Calculator RRR MT5 | Prop Firm Protector: Trade Assist Prop Firm Plus TF Expert MT5 | Money Management + DrawDown Protector: Trade Panel Prop Firm Drawdawn Limiter Pro MT5 |Get a free Expert Advisor license via Telegram and WhatsApp
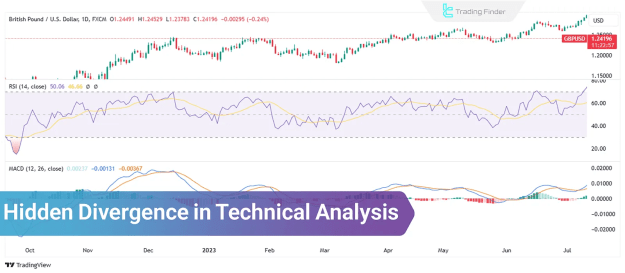
What Is Hidden Divergence in Technical Analysis?
In technical analysis, hidden divergence occurs when the price maintains its trend direction while the indicator shows signals that typically suggest a reversal. However, rather than reversing, the price continues along the dominant trend.
While regular divergence indicates a possible trend reversal, hidden divergence is interpreted as a confirmation of the current market direction, providing traders with increased confidence to stay with the trend.
Types of Hidden Divergence in Technical Analysis
Hidden divergence appears in two main forms:
- Bullish Hidden Divergence
- Bearish Hidden Divergence
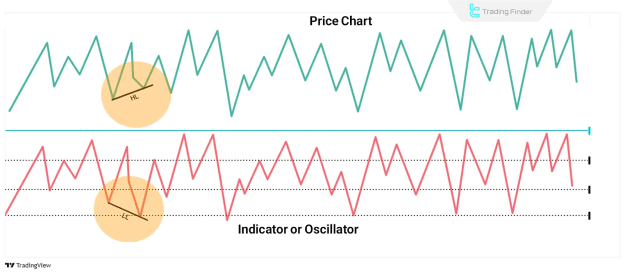
Bullish Hidden Divergence
Bullish hidden divergence occurs when the price creates a higher low, while the indicator (such as RSI or MACD) forms a lower low. This typically emerges in uptrending markets and is considered a continuation signal for further price appreciation.
Example: A bullish hidden divergence reflects ongoing buying pressure, even as the oscillator dips lower, highlighting strength in the existing uptrend.
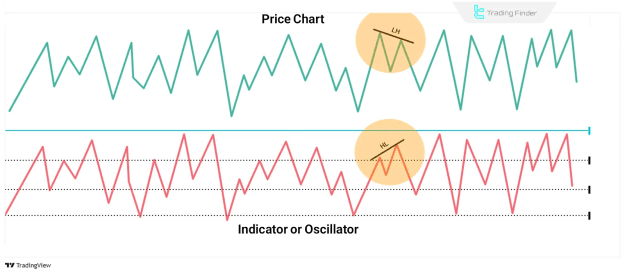
Bearish Hidden Divergence
Bearish hidden divergence is observed when the price forms a lower high, while the technical indicator shows a higher high. This type of divergence typically appears in downtrends and suggests that the bearish momentum is likely to continue.
Example: A bearish hidden divergence signals persistent selling strength, even as the oscillator pushes upward, reinforcing the downward price trend.
How to Trade with Hidden Divergence
Trading based on hidden divergence requires analytical precision and the integration of confirmation tools. Below are the general steps to apply hidden divergence in trading strategies:
1. Identifying Hidden Divergence
Start by identifying potential hidden divergence between the price and indicators such as:
- Relative Strength Index (RSI)
- Moving Average Convergence Divergence (MACD)
- Stochastic Oscillator
2. Confirming the Signal
To validate the divergence, use complementary confirmation tools, including:
- Candlestick patterns
- Trendlines
- Fibonacci retracement levels
These tools increase the reliability of the hidden divergence signal before entering a position.
3. Entering the Trade
Once confirmation is achieved:
- For bullish hidden divergence, consider entering a long (buy) position
- For bearish hidden divergence, consider entering a short (sell) position
4. Managing Risk
Implement appropriate risk management strategies by setting:
- Stop-loss orders to protect against unexpected moves
- Take-profit levels to lock in gains
Risk management is critical for mitigating potential losses and maintaining consistency.
Hidden Divergence vs. Regular Divergence
There are key differences between hidden and regular divergence:
- Regular Divergence: Occurs when the price and the indicator move in opposite directions, typically signaling a trend reversal.
- Hidden Divergence: Happens when the price continues in the direction of the trend, while the indicator moves against it, usually confirming trend continuation.
In summary, regular divergence suggests a potential change in market direction, whereas hidden divergence reinforces the likelihood of the current trend persisting.
Is Hidden Divergence Effective in Forex Trading?
Hidden divergence in forex trading is one of the most effective techniques for identifying continuation points within currency pair movements. It enables traders to stay aligned with the dominant trend and take advantage of minor corrections to enter positions with lower risk.
Forex traders often combine hidden divergence with trendline analysis, support and resistance levels, and price action techniques to enhance their entry and exit decisions.
Conclusion
Hidden divergence is a powerful tool in technical analysis for recognizing trend continuation across various markets, including forex, cryptocurrencies, and equities. It is identified by analyzing discrepancies between price action and technical indicators such as RSI, MACD, and Stochastic.
When combined with proper confirmation tools and risk management, hidden divergence can significantly enhance a trader’s strategy, particularly in trend-following approaches such as swing trading, breakout trading, and support/resistance strategies.