- Reversal Patterns – Indicate a potential trend change.
- Continuation Patterns – Suggest the trend will resume after a brief consolidation.
As a foundational concept in Forex education, these patterns are widely used in Forex, stocks, and cryptocurrency markets due to their ability to define entry points, exit levels, and stop-loss placements.
TP & SL Tool: Risk Reward Ratio Calculator RRR MT5 | Prop Firm Protector: Trade Assist Prop Firm Plus TF Expert MT5 | Money Management + DrawDown Protector: Trade Panel Prop Firm Drawdawn Limiter Pro MT5 |Get a free Expert Advisor license via Telegram and WhatsApp
Why Traders Use Classic Chart Patterns
Despite being traditional tools, classic patterns remain popular because of:
- Ease of Identification – Visually recognizable on price charts.
- Compatibility with Other Tools – Works well with indicators, volume analysis, and candlestick patterns.
- Reliability in Multiple Markets – Applicable across Forex, equities, and crypto.
Reliable Classic Chart Patterns
Reversal Patterns
Reversal patterns signal a weakening trend and a possible shift in price direction.
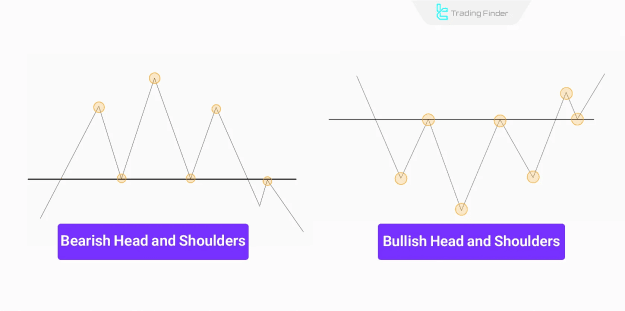
1. Head and Shoulders (H&S)
The Head and Shoulders pattern indicates the end of an uptrend, while the Inverse H&S marks a downtrend reversal.
- Structure: One higher peak (head) between two lower peaks (shoulders).
- Best Timeframes: H1, H4, Daily (medium to long-term trends).
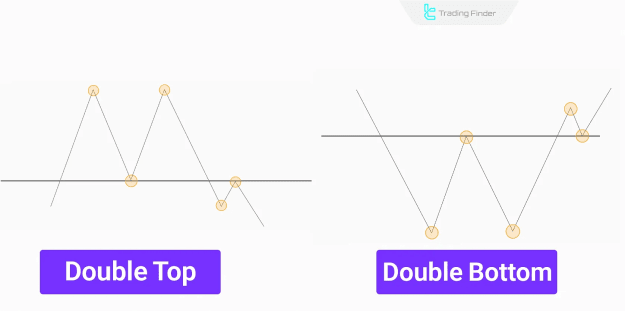
2. Double Top & Double Bottom
- Double Top: Two peaks at resistance, signaling a bearish reversal.
- Double Bottom: Two troughs at support, indicating a bullish reversal.
- Ideal Timeframes: M30, H1, H4 (short to medium-term).
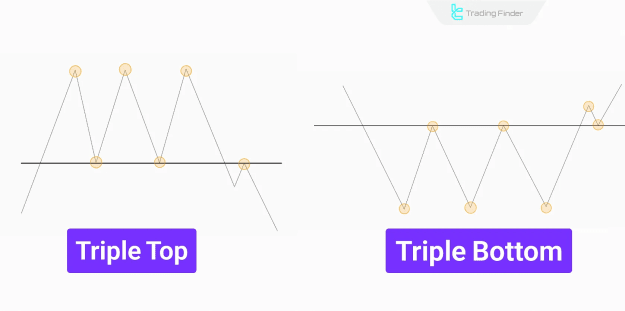
3. Triple Top & Triple Bottom
- Triple Top: Three failed resistance tests, leading to a downtrend.
- Triple Bottom: Three support bounces, suggesting an uptrend.
- Best Timeframes: H4, Daily, Weekly (long-term trends).
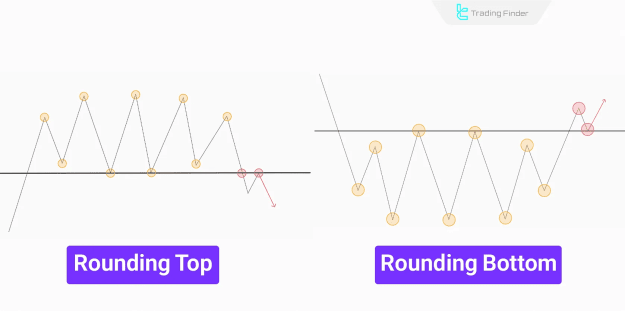
4. Rounding Bottom & Rounding Top
- Rounding Bottom: Gradual U-shaped recovery, bullish signal.
- Rounding Top: Slow arc-shaped decline, bearish signal.
- Timeframes: Daily, Weekly (slow-forming patterns).
Continuation Patterns
These patterns suggest the trend will continue after a brief pause.
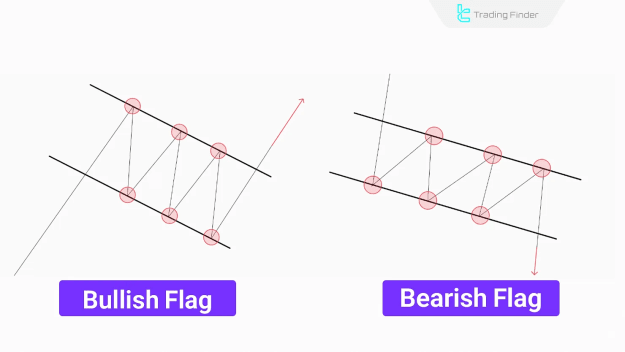
1. Flag Pattern
A Flag forms after a sharp price move (flagpole) and consolidates in a small channel before continuing the trend.
- Best for: Scalping & day trading (M5 to H1 timeframes).
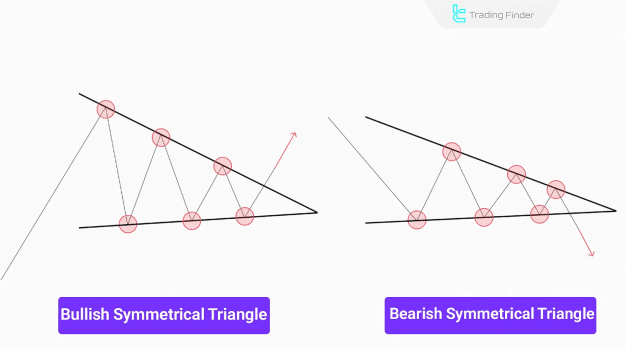
2. Symmetrical Triangle
Price fluctuates within converging trendlines before breaking out in the trend's direction.
- Works in: Uptrends & downtrends.
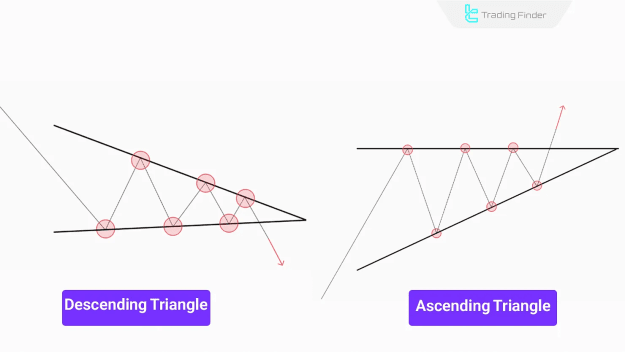
3. Ascending & Descending Triangles
- Ascending Triangle: Flat resistance + higher lows → Bullish breakout.
- Descending Triangle: Flat support + lower highs → Bearish breakout.
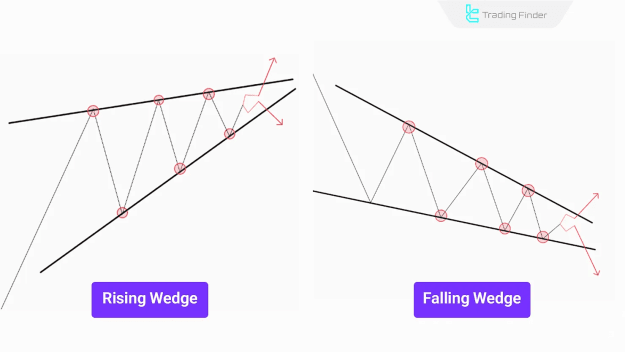
4. Wedges
- Rising Wedge: Slopes upward, typically breaks bearish.
- Falling Wedge: Slopes downward, usually breaks bullish.
5. Rectangle Pattern
Price moves sideways between support & resistance before a breakout.
Advantages & Limitations of Classic Patterns
Advantages
- Simple visual identification.
- Works across all financial markets.
- Combines well with indicators (RSI, MACD, volume).
Disadvantages
- Risk of false breakouts.
- Requires confirmation from other tools.
- Delayed signal confirmation in slow markets.
Enhancing Pattern Accuracy with Confirmation Tools
To improve reliability, traders combine classic patterns with:
- Candlestick Analysis – Confirms buyer/seller pressure.
- Volume Analysis – Breakouts with high volume are stronger.
- Technical Indicators – RSI, MACD, and Moving Averages add confirmation.
- Multi-Timeframe Analysis – Ensures consistency across charts.
Combining Classic Patterns with Indicators
RSI for Overbought/Oversold Confirmation
- If a Double Bottom forms while RSI is oversold → Strong bullish reversal signal.
MACD for Trend Strength
- A Head and Shoulders breakout + MACD bearish crossover → Higher probability of a downtrend.
Conclusion
Classic patterns like Head and Shoulders, Double Tops/Bottoms, Flags, and Triangles help traders anticipate trend reversals and continuations.
For best results, combine them with:
- Candlestick analysis
- Volume confirmation
- Momentum indicators (RSI, MACD)
By integrating these techniques, traders can reduce false signals and improve decision-making in Forex, stocks, and crypto markets.