TP & SL Tool: Risk Reward Ratio Calculator RRR MT5 | Prop Firm Protector: Trade Assist Prop Firm Plus TF Expert MT5 | Money Management + DrawDown Protector: Trade Panel Prop Firm Drawdawn Limiter Pro MT5 |Get a free Expert Advisor license via Telegram and WhatsApp
Essential ICT Time Levels and Their Significance
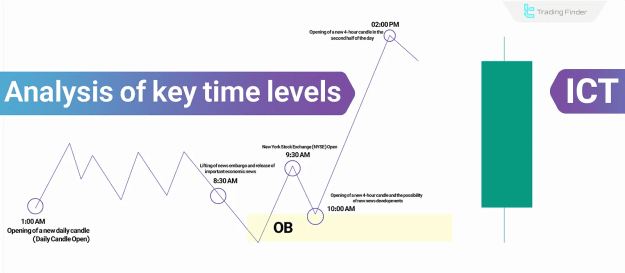
The ICT methodology emphasizes specific time levels that influence market behavior. These include:
- 01:00 AM (EST) – Daily Candle Open: Marks the beginning of a new trading day, setting the tone for price action.
- 08:30 AM (EST) – Major News Releases: Economic data and news embargo lifts often trigger volatility.
- 09:30 AM (EST) – NYSE Open: A high-liquidity session that impacts forex and other markets.
- 10:00 AM & 02:00 PM (EST) – 4-Hour Candle Formations: Crucial for identifying intraday trends and reversals.
These time levels help traders assess liquidity, detect trend shifts, and anticipate potential breakouts or reversals.
Analyzing Bullish and Bearish Candles Using ICT Time Levels
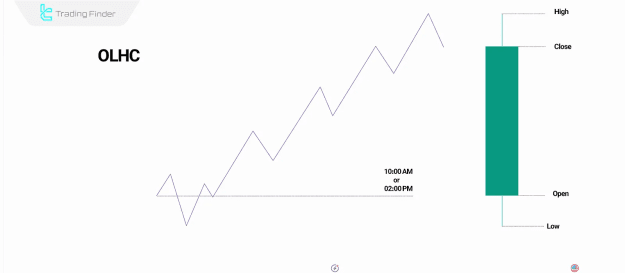
OLHC & OHLC Structures in Market Analysis
By examining Open, Low, High, and Close (OLHC & OHLC) patterns at key ICT time levels, traders can gauge market sentiment:
- Premium Zone: If price rises at midnight (12:00 AM) in a bearish trend, it often signals an impending decline.
- Discount Zone: If price stays below opening levels, it suggests a higher probability of an upward reversal.
Midnight Open and 8:30 AM as Support/Resistance
The Midnight Open and 8:30 AM levels frequently act as dynamic support or resistance:
- Support: If price bounces upward near these levels, they reinforce bullish momentum.
- Resistance: Failure to break above these zones often leads to rejections and trend reversals.
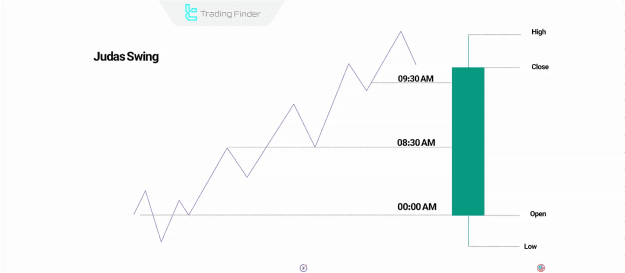
Additionally, these times are prone to Judas Swings—false breakouts designed to trap traders before a true reversal.
Judas Swings and Order Blocks in ICT Trading
Identifying Reversals with Judas Swings
A Judas Swing occurs when price makes a deceptive move before reversing:
- In an uptrend, a bearish fakeout at 08:30 AM followed by a strong close above indicates continuation.
- A failed breakdown at 09:30 AM followed by a bullish recovery suggests an Order Block formation.
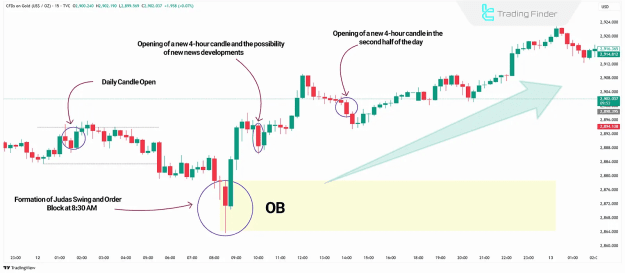
Bullish Example: Gold Price Action
On a 15-minute gold chart, the 01:00 AM daily candle sets the stage. At 08:30 AM, a Judas Swing occurs post-news, forming an Order Block before resuming the uptrend.
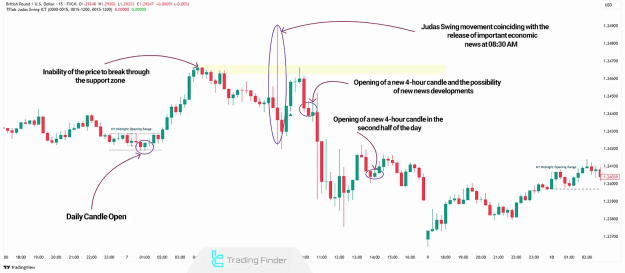
Bearish Example: GBP/USD Rejection
In GBP/USD, price rallies after the daily open but faces rejection at a key support level. A Judas Swing at 08:30 AM confirms bearish continuation, aligning with news-driven momentum.
Conclusion
ICT time levels provide a structured approach to market analysis, helping traders identify high-probability setups. By monitoring OLHC/OHLC patterns, Judas Swings, and Order Blocks, traders can refine their entries and exits with precision. Mastering these time-based strategies enhances decision-making and improves overall trading performance.