TP & SL Tool: Risk Reward Ratio Calculator RRR MT5 | Prop Firm Protector: Trade Assist Prop Firm Plus TF Expert MT5 | Money Management + DrawDown Protector: Trade Panel Prop Firm Drawdawn Limiter Pro MT5 |Get a free Expert Advisor license via Telegram and WhatsApp
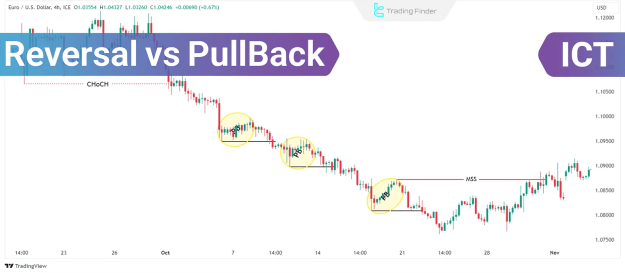
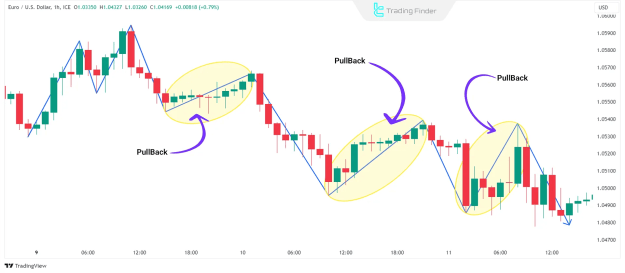
What Is a Pullback?
A pullback is a temporary counter-trend movement within an existing trend. For example, in an uptrend, the price may retrace slightly before resuming its upward trajectory.
Key Characteristics of a Pullback:
- Occurs within the prevailing trend.
- Typically has lower trading volume.
- Does not break critical support/resistance levels.
- Seen as an opportunity to enter trades at better prices.
Example: In an uptrend, a pullback allows traders to buy at a lower price before the trend continues.
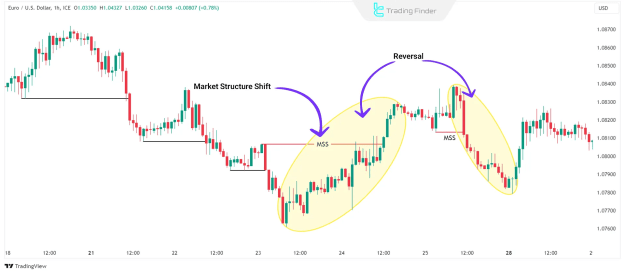
What Is a Reversal?
A reversal signals a major shift in market direction, marking the end of one trend and the beginning of another.
Key Characteristics of a Reversal:
- Breaks key market structure levels (e.g., higher highs/lows in an uptrend).
- Often accompanied by increased trading volume.
- Reflects a change in market sentiment.
Example: A downtrend reversing into an uptrend indicates bullish momentum taking over.
Key Differences Between Pullbacks and Reversals
To differentiate between pullbacks and reversals, traders use:
1. Trendline Analysis
- Draw trendlines connecting short-term highs and lows.
- A break of the trendline may signal a reversal.
2. Breakout Confirmation
- A pullback holds within key levels, while a reversal breaks them.
- Watch for breakouts above resistance or below support.
3. Volume Analysis
- High volume during a breakout confirms a reversal.
- Low volume suggests a pullback.
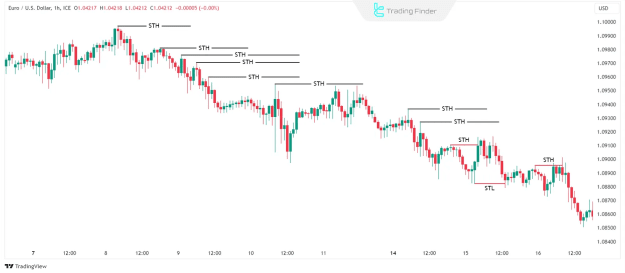
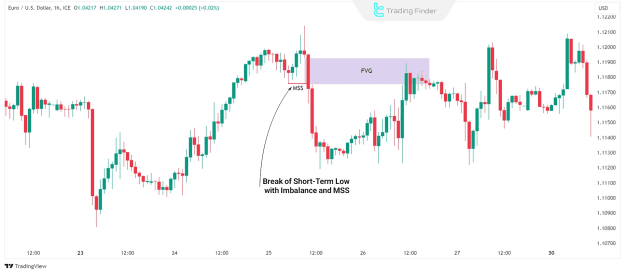
4. Short-Term Highs and Lows (STH/STL)
- In an uptrend, a break below a short-term low (STL) suggests a reversal.
- If STL holds, it’s likely a pullback.
Identifying Market Imbalances for Reversals
Market imbalances, such as Fair Value Gaps (FVG), often precede reversals. These occur when supply and demand shift sharply, leading to structural changes in price.
Signs of an Imbalance:
- Sharp price movements.
- Increased trading volume.
- Unfilled liquidity zones.
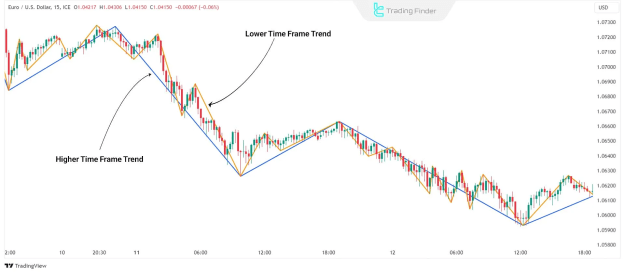
The Role of Higher Timeframes in Trend Analysis
Higher timeframes (e.g., daily, weekly) provide a clearer trend perspective, reducing noise from minor fluctuations.
How to Use Higher Timeframes Effectively:
- Identify the Dominant Trend – Use daily/weekly charts to confirm the primary trend.
- Mark Key Levels – Support/resistance on higher timeframes act as strong entry/exit points.
- Multi-Timeframe Confluence – A pullback on a lower timeframe (e.g., 1-hour) in line with a higher timeframe trend strengthens trade setups.
Conclusion
Mastering the distinction between pullbacks and reversals is essential for Forex and crypto traders. By applying market structure analysis, volume confirmation, and multi-timeframe alignment, traders can enhance decision-making and optimize entries/exits.
Understanding these concepts helps traders follow Smart Money movements and capitalize on high-probability setups while avoiding false signals.