TP & SL Tool: Risk Reward Ratio Calculator RRR MT5 | Prop Firm Protector: Trade Assist Prop Firm Plus TF Expert MT5 | Money Management + DrawDown Protector: Trade Panel Prop Firm Drawdawn Limiter Pro MT5 |Get a free Expert Advisor license via Telegram and WhatsApp
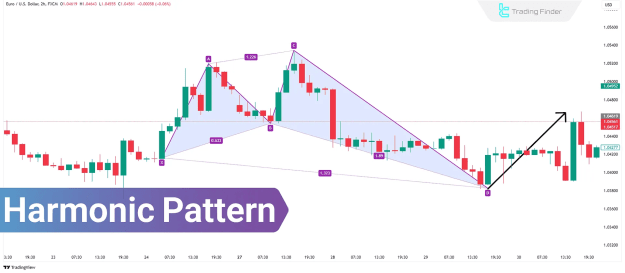
What Are Harmonic Patterns?
Harmonic patterns integrate Fibonacci retracements and extensions with specific price movements to predict future market behavior. By using these patterns, traders can determine potential reversal zones (PRZ) and execute precise entry and exit strategies. Some of the most recognized harmonic formations include the ABCD, Bat, Gartley, Butterfly, Crab, Deep Crab, and Shark patterns.
Benefits and Limitations of Harmonic Patterns
Advantages:
- High accuracy due to the precise use of Fibonacci ratios
- Applicable across multiple markets and timeframes
- Provides well-defined entry and exit points for trade setups
Disadvantages:
- Complexity in manual pattern identification
- Strong reliance on Fibonacci measurement tools
- Subjective interpretation of pattern structures
Introduction to Various Harmonic Patterns
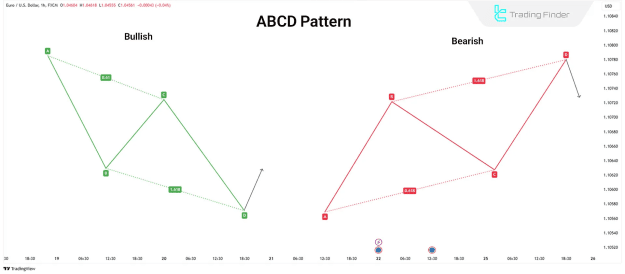
ABCD Pattern
The ABCD pattern is one of the foundational harmonic formations. It consists of three legs and four key price points: AB, BC, and CD.
- AB represents the initial move
- BC is a corrective phase in the opposite direction
- CD moves in the same direction as AB and is typically equal in both time and length
Fibonacci Guidelines:
- BC should retrace approximately 0.618 of AB
- CD should mirror the length of AB
Traders may choose to initiate trades at point C or wait for confirmation at point D, which forms the PRZ.
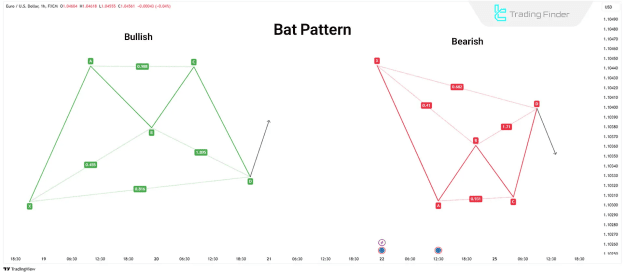
Bat Pattern
First defined by Scott Carney in 2001, the Bat pattern is valid when point B retraces 50% of the XA leg.
Key Fibonacci Levels:
- Point B must retrace between 38.2% and 50% of XA
- CD extends a minimum of 1.618 of BC
- Point D marks the PRZ
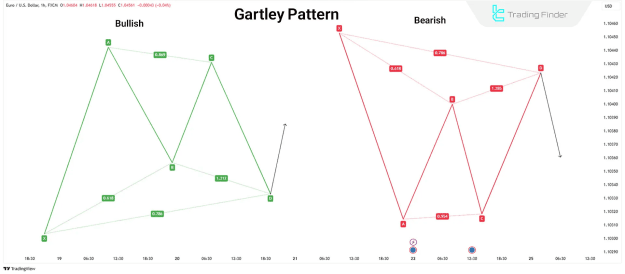
Gartley Pattern
Developed by H.M. Gartley, this pattern resembles the Bat structure but adheres to stricter Fibonacci parameters.
Fibonacci Structure:
- Point B retracement must be exactly 0.618 of XA
- Point D terminates at 0.786 of XA
Trade setups typically place the stop-loss at point X, with a profit target near point C.
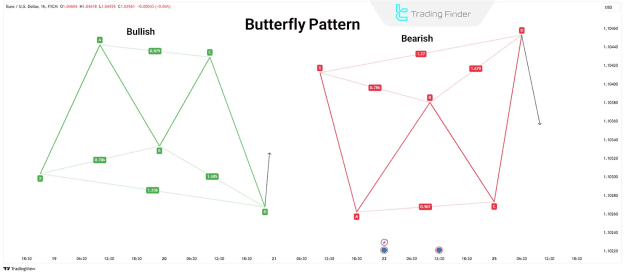
Butterfly Pattern
The Butterfly pattern, introduced by Bryce Gilmore, is a reversal formation made up of four moves: XA, AB, BC, and CD. It is similar to the Gartley but with a deeper final leg.
Fibonacci Rule:
- Point B is determined by a 0.786 retracement of the XA leg, with D forming the PRZ
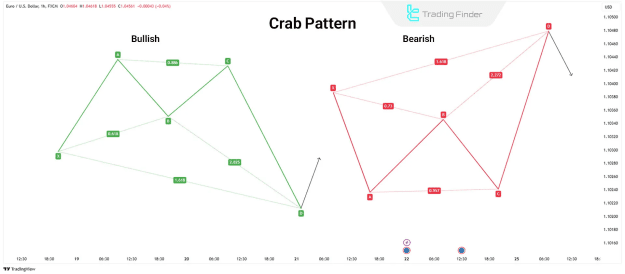
Crab Pattern
Another structure introduced by Scott Carney, the Crab pattern offers extremely precise PRZs at market extremes.
Fibonacci Ratios:
- Point D must be a 1.618 extension of XA
- BC typically extends between 2.618 and 3.618 of AB
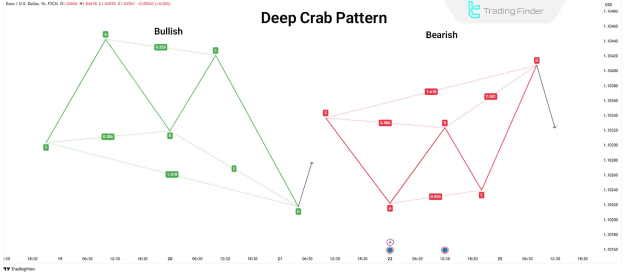
Deep Crab Pattern
A variant of the standard Crab pattern, the Deep Crab adjusts the B point:
- Point B retraces 0.886 of XA
- BC projection ranges from 2.24 to 3.618
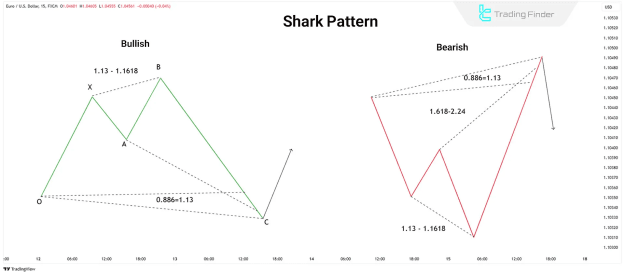
Shark Pattern
Also introduced by Carney, the Shark pattern is slightly different in structure, consisting of five points: O, X, A, B, and C.
Fibonacci Requirements:
- AB should be 1.13 to 1.618 of XA
- BC reaches 113% of OX
- Point D is located at a 50% retracement of BC
Trades are typically opened at point C, with point D serving as the target zone.
Identifying and Drawing Harmonic Patterns
The process of identifying harmonic patterns includes several crucial steps:
- Detect significant pivot points (X, A, B, C, D) on the price chart
- Apply Fibonacci retracement and extension tools to measure price moves
- Recognize the pattern formation using specialized tools like:
- Harmonic Pattern Indicator for MetaTrader 4
- Harmonic Pattern Indicator for MetaTrader 5
- Harmonic Pattern Indicator for TradingView
- Define stop-loss and take-profit levels based on PRZ analysis
Trading Signals and Success Metrics
Harmonic patterns produce multiple key trading signals:
- Potential Reversal Zone (PRZ): Identifies possible reversal points with high probability
- Stop-Loss Zone (SLZ): Defines areas where trades should be exited to minimize losses
- Profit Protection Zone (PPZ): Indicates zones to lock in profits
- Initial Profit Objective (IPO): Targets based on Fibonacci-based price retracement levels
Conclusion
Harmonic patterns offer a structured and highly accurate approach to market analysis. By combining Fibonacci ratios with specific geometric price formations, traders can predict potential reversal points and optimize trade entries and exits. Whether it's the ABCD, Bat, Gartley, Butterfly, Crab, Deep Crab, or Shark pattern, incorporating these tools into a broader trading strategy—especially when combined with volume analysis and trend indicators—can significantly enhance the success rate of trades.