TP & SL Tool: Risk Reward Ratio Calculator RRR MT5 | Prop Firm Protector: Trade Assist Prop Firm Plus TF Expert MT5 | Money Management + DrawDown Protector: Trade Panel Prop Firm Drawdawn Limiter Pro MT5 |Get a free Expert Advisor license via Telegram and WhatsApp
The Role of Fibonacci in ICT Trading
The Fibonacci tool is integrated with Standard Deviation projections to identify:
- Key retracement zones
- Price expansion targets
- Confluence areas for reversals
This combination enhances precision in determining high-probability trade setups.
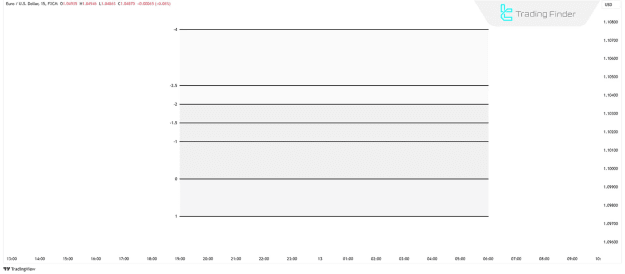
Fibonacci Settings for Standard Deviation in ICT
ICT traders utilize specific Fibonacci levels within Standard Deviation analysis:
- 1 (Mean Reversion Level)
- 0 (Baseline)
- -1 (Initial Retracement)
- -2 (Strong Reaction Zone)
- -2.5 (Potential Reversal Area)
- -4 (Maximum Expansion Target)
These levels act as dynamic support/resistance zones, guiding entry and exit decisions.
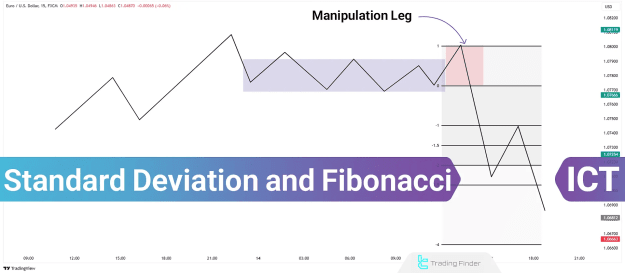
How to Apply Standard Deviation & Fibonacci in Trading
Step 1: Identifying the Manipulation Leg
- In an uptrend or downtrend, a retracement or liquidity sweep often forms before a reversal.
- This manipulation leg serves as the anchor for Fibonacci and Standard Deviation analysis.
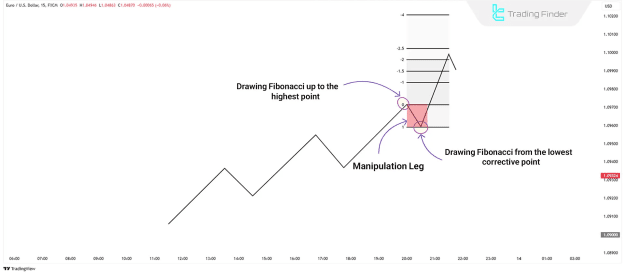
Step 2: Plotting Fibonacci Levels
- Draw the Fibonacci tool from the low to high (bullish) or high to low (bearish) of the manipulation leg.
- The -2 to -2.5 levels often act as reversal zones.
- A break beyond -2.5 suggests continuation toward -4.
Step 3: Confirming with ICT Concepts
- PD Arrays (Premium/Discount Zones) – Align with Standard Deviation levels for stronger confluence.
- Fair Value Gaps (FVGs) – Overlap with Fibonacci retracements increases trade validity.
- Market Structure Shifts – Validate reversals at key Standard Deviation zones.
Practical Trading Examples
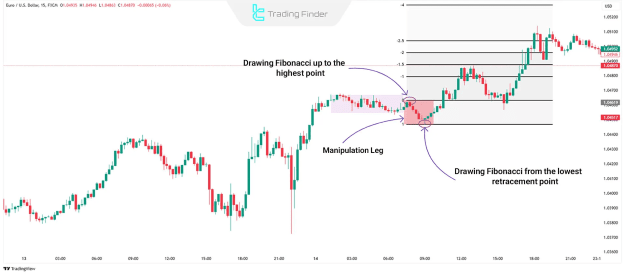
Bullish Scenario (EUR/USD 15-Minute Chart)
- Price forms a manipulation leg after a ranging phase.
- Fibonacci tool is drawn from the low to high of the corrective move.
- Price reacts at -2.5, confirming a bullish reversal.
- Target zones: -1 (retracement) and -4 (expansion).
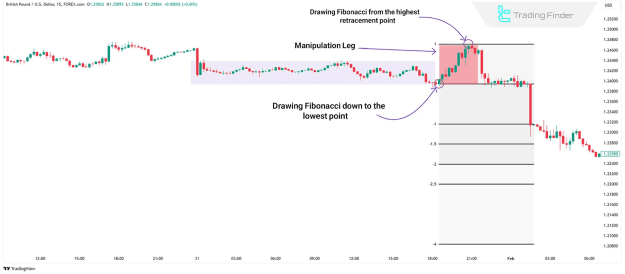
Bearish Scenario (GBP/USD 15-Minute Chart)
- A fake breakout (liquidity grab) occurs before a downtrend.
- Fibonacci levels are plotted from the high to low.
- Price rejects at -2, signaling further downside.
- Final target: -4 Standard Deviation level.
Advantages of Combining Standard Deviation & Fibonacci
- Identifies Smart Money Manipulation – Detects liquidity sweeps and stop hunts.
- Improves Risk-Reward Ratios – Clear support/resistance zones refine entries.
- Works with Multiple Timeframes – Applicable in scalping, swing, and position trading.
Conclusion
In ICT trading, the Standard Deviation tool and Fibonacci retracements work synergistically to:
- Predict price reversals at key levels (-2, -2.5).
- Project expansion targets (-4 level).
- Enhance confluence with PD Arrays, FVGs, and market structure.
By mastering this approach, traders gain an edge in identifying high-probability setups while minimizing false signals.