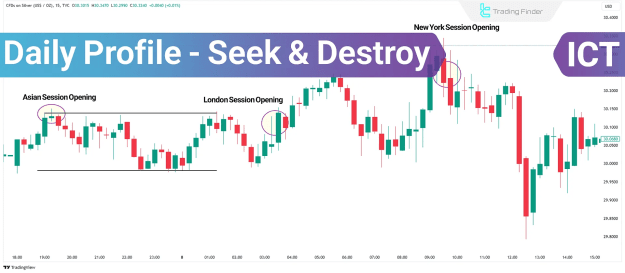
What Is the Seek & Destroy (S&D) Profile?
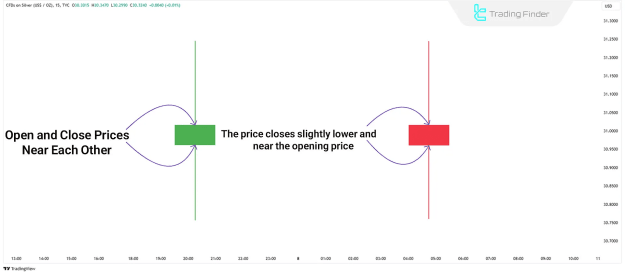
The S&D profile manifests on daily charts as an Indecision Candle, where the opening and closing prices are nearly identical. This indicates a lack of directional bias, with price action fluctuating without a clear trend.
Key Characteristics of the S&D Profile
- No clear market direction at the start of the trading day.
- London session may push price in one direction, but the move is later reversed.
- False breakouts occur frequently, with price returning to the initial range.
- Choppy price action dominates lower timeframes, making trend-following strategies less effective.
Why Does the Seek & Destroy (S&D) Profile Occur?
The S&D profile typically forms under specific market conditions:
- Awaiting Major Economic News – Uncertainty before high-impact events like CPI, FOMC, or NFP reports can lead to indecisive price action.
- Absence of Higher Timeframe Direction – When daily or weekly charts lack a clear trend, lower timeframes exhibit random, range-bound movements.
- Market Consolidation – After strong trending moves, the market often enters a phase of equilibrium, resulting in S&D behavior.
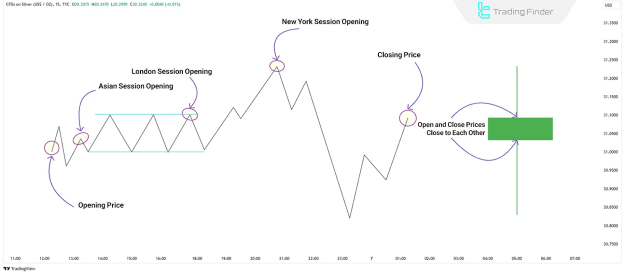
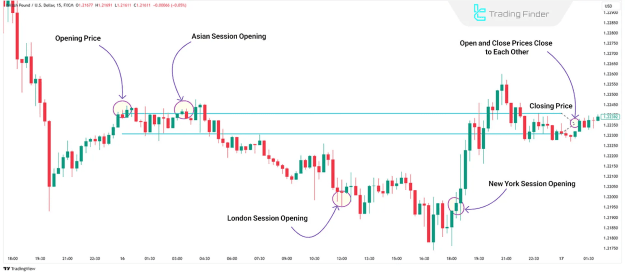
How to Identify the Seek & Destroy (S&D) Profile
To recognize the S&D profile, traders should analyze key Kill Zones and session behaviors:
1. Asia Session
- Establishes the initial trading range for the day.
- Price action remains contained, showing no strong directional bias.
2. London Session
- Price may break the Asian range but fails to sustain momentum.
- Frequent false breakouts occur, followed by reversals.
3. New York Session
- Price often retraces back into the Asian range, confirming consolidation.
- No strong trend continuation, leading to choppy trading conditions.
Trading Strategies for the S&D Profile
Since the S&D profile indicates market indecision, traders should adopt a range-bound approach rather than chasing breakouts.
1. Focus on Mean Reversion
- Instead of trading breakouts, look for pullbacks into the Asian or London range.
- Fade extreme moves when price reaches premium or discount zones.
2. Identify Key Equilibrium Levels
- Use the London session range to mark support and resistance.
- Enter trades when price retests these levels with confirmation.
3. Avoid Over-Trading
- Due to low volatility and false moves, reduce trade frequency.
- Wait for clear price rejection at key levels before entering.
Risks of Trading the S&D Profile
While the S&D profile provides valuable insights, traders must be aware of its challenges:
- Increased False Breakouts – Price often reverses, triggering stop losses.
- Low Probability Setups – Choppy conditions reduce high-quality trade opportunities.
- Reduced New York Session Momentum – If London establishes a tight range, strong directional moves are less likely.
Conclusion
The Seek & Destroy (S&D) Profile is a crucial concept in ICT trading, helping traders navigate consolidation phases and indecisive markets. By recognizing this pattern, traders can avoid unnecessary risks and focus on high-probability setups.
For optimal results, traders should combine S&D analysis with other ICT concepts, such as liquidity sweeps and order block strategies, to enhance decision-making in uncertain market conditions.