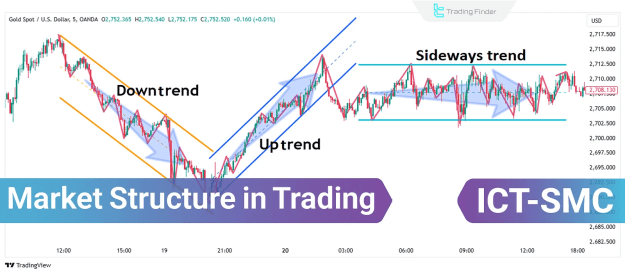
What Is Market Structure?
Market Structure refers to the framework of price action, encompassing swing highs, swing lows, and trend direction. It helps traders determine whether the market is in a bullish, bearish, or ranging phase. Accurately identifying these structures is essential for setting trade direction, entry points, and exit strategies.
Advantages and Limitations of Market Structure Analysis
Pros of Market Structure Trading
- Accurate Trend Identification: Helps traders recognize trend continuations and reversals.
- Optimal Entry and Exit Points: Provides clear levels for trade execution.
- Enhanced Risk Management: Identifies key reversal zones to minimize losses.
Cons of Market Structure Trading
- False Signals in Volatility: Highly unstable markets may generate misleading breakouts.
- Requires Expertise: Proper interpretation demands experience and precision.
- Noise in Lower Timeframes: Short-term charts can be harder to analyze due to market noise.
Types of Market Structures
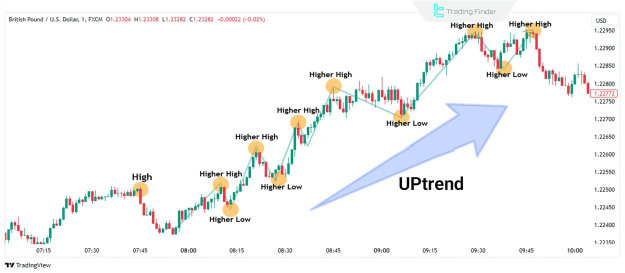
1. Bullish Market Structure
A bullish trend is characterized by Higher Highs (HH) and Higher Lows (HL). Confirmation occurs when price breaks above the previous high, signaling trend continuation. A break below the last Higher Low (HL) may indicate a potential reversal.
Key Feature:
- Successively higher peaks and troughs confirm upward momentum.
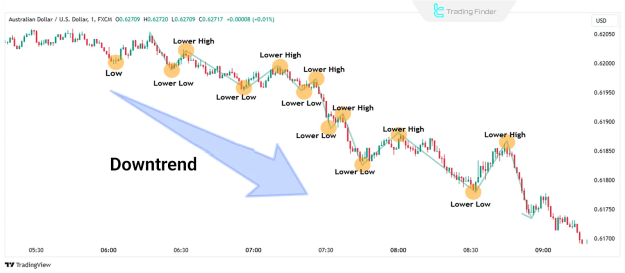
2. Bearish Market Structure
A bearish trend consists of Lower Highs (LH) and Lower Lows (LL). A breakdown below the prior low suggests downtrend continuation. If price forms a Higher High (HH), a trend reversal to bullish may be underway.
Key Feature:
- Consistently declining highs and lows indicate sustained selling pressure.
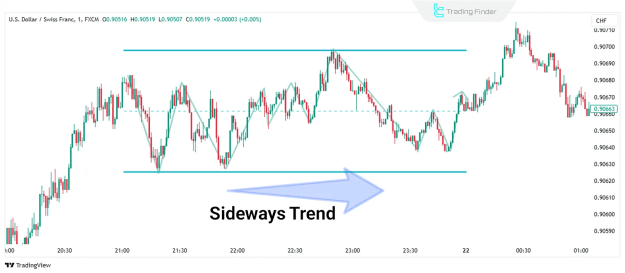
3. Ranging (Sideways) Market Structure
In a ranging market, price oscillates between defined support and resistance levels without a clear trend. Traders often capitalize on range-bound strategies until a breakout occurs.
Key Feature:
- Repeated tests of upper and lower boundaries with no significant directional bias.
How to Identify Market Structure Across Timeframes
Market structure is visible in all timeframes, but higher timeframes (e.g., daily, weekly) offer more reliable signals. Lower timeframes (e.g., 1H, 15M) contain more noise, making analysis challenging.
Best Practice:
- Use Top-Down Analysis—start with higher timeframes to confirm structure before zooming into lower ones.
Detecting Market Structure Shifts
A trend reversal is signaled when key levels are breached:
- In an Uptrend: Breaking the last Higher Low (HL) suggests weakening bullish momentum.
- In a Downtrend: Breaking the last Lower High (LH) indicates potential bullish reversal.
- Displacement (rapid price movements) often accompanies these shifts.
Essential Tips for Effective Market Structure Analysis
- Identify True Swing Highs and Lows – Focus on significant price pivots.
- Ignore Minor Noise – Filter out insignificant fluctuations.
- Combine with ICT PD Array (Premium/Discount Zones) – Strengthen analysis with supply/demand zones.
- Multi-Timeframe Confirmation – Align structure across higher and lower timeframes.
- Volume Analysis – Validate breakouts with trading volume.
- Continuous Practice – Improve accuracy by analyzing different market conditions.
Final Thoughts
Market Structure is a foundational concept in technical analysis, helping traders interpret price action and market trends. By recognizing bullish, bearish, and ranging structures, traders can enhance their decision-making process. Mastery of market structure, combined with complementary tools, leads to more strategic and disciplined trading.
For further insights, explore advanced techniques such as ICT and SMC Trading methodologies to refine your approach.