- Detect emerging trends before they fully develop
- Identify potential reversal points
- Enhance decision-making with predictive insights and Technical Analysis tools can help detect emerging trends before they fully develop.
When combined with other technical tools, leading indicators significantly improve analysis accuracy and trading performance.
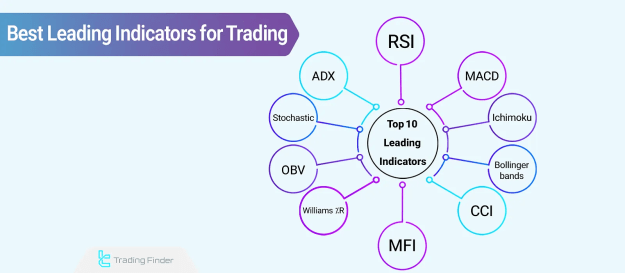
Top 10 Leading Indicators Every Trader Should Know
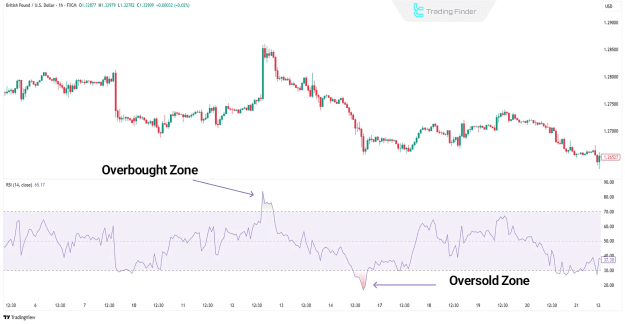
1. Relative Strength Index (RSI)
A momentum oscillator measuring price movement velocity:
- Overbought: Above 70 (potential pullback)
- Oversold: Below 30 (possible bounce)
- Divergences: Warn of potential trend reversals
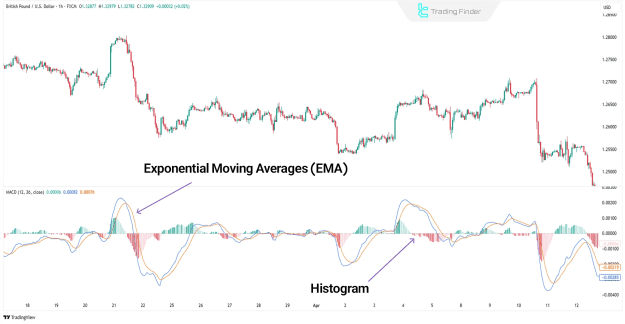
2. Moving Average Convergence Divergence (MACD)
A versatile trend-following momentum indicator featuring:
- Signal line crossovers (entry/exit signals)
- Histogram (momentum strength)
- Zero-line crosses (trend confirmation)
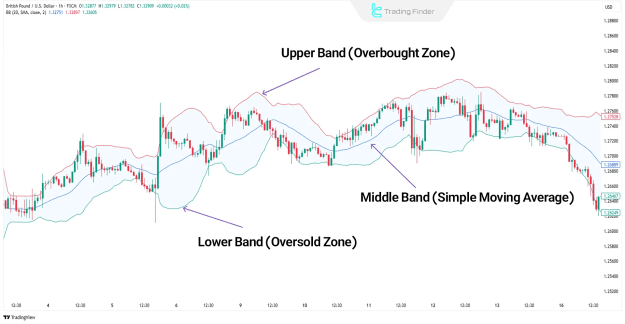
3. Bollinger Bands
Bollinger Bands Volatility-based bands that identify:
- Overbought/oversold conditions (price touching bands)
- Squeezes (impending volatility bursts)
- Trend strength (band width expansion/contraction)
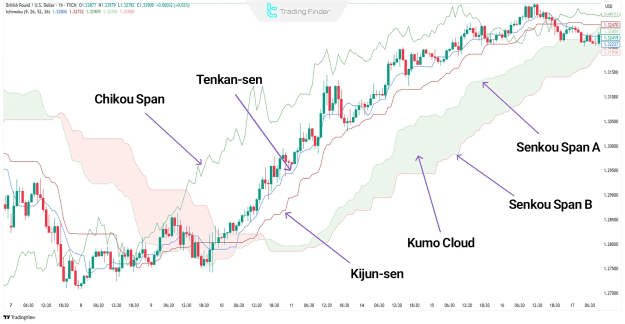
4. Ichimoku Cloud
A comprehensive Japanese indicator providing:
- Support/resistance (Kumo cloud)
- Trend direction (price relative to cloud)
- Momentum (Tenkan-Sen/Kijun-Sen crossovers)
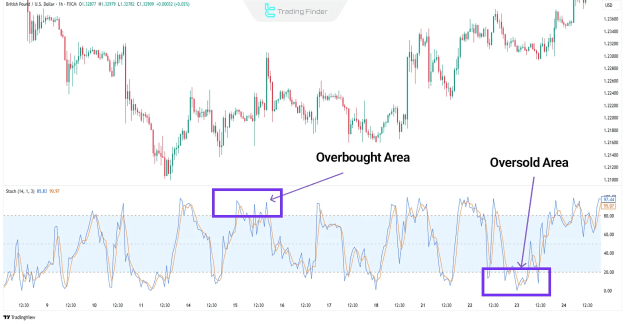
5. Stochastic Oscillator
Momentum indicator comparing closing prices to price ranges:
- Overbought: Above 80
- Oversold: Below 20
- Crossovers: Potential trend changes
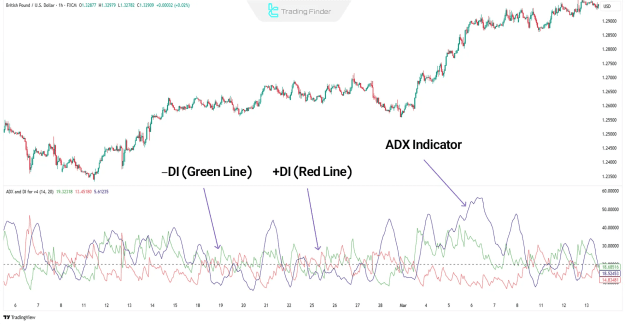
6. Average Directional Index (ADX)
Measures trend strength (not direction) using:
- ADX line (strength above 25)
- +DI/-DI lines (trend direction)
- Ideal for confirming existing trends
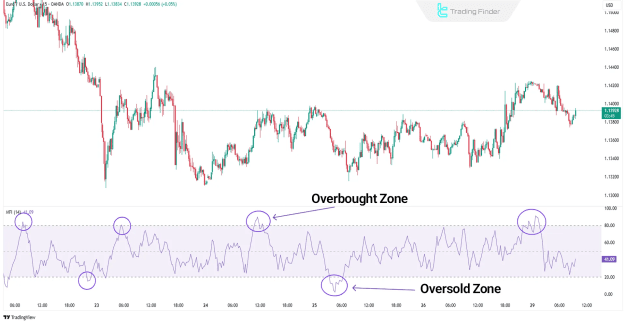
7. Money Flow Index (MFI)
Volume-weighted RSI alternative identifying:
- Overbought/oversold levels (80/20)
- Divergences (potential reversals)
- Money flow trends
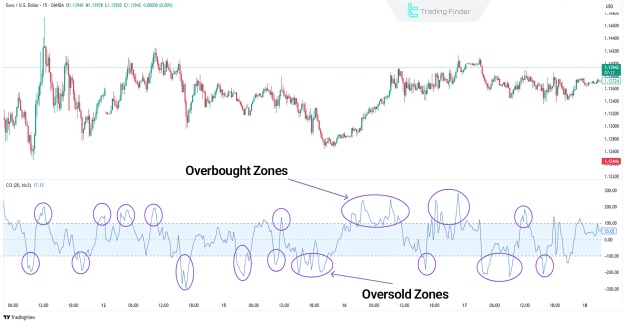
8. Commodity Channel Index (CCI)
Cyclical trend indicator highlighting:
- Extreme levels (+100/-100)
- Trend reversals
- Divergence signals
9. Williams %R
Momentum oscillator measuring overbought/oversold:
- Overbought: Above -20
- Oversold: Below -80
- Effective for short-term trading
10. On-Balance Volume (OBV)
Volume-based indicator tracking:
- Accumulation/distribution
- Bullish/bearish divergences
- Trend confirmation
How to Use Leading Indicators Effectively
- Combine indicators: Use RSI with MACD or Bollinger Bands for confirmation
- Adjust timeframes: Shorter periods for day trading, longer for swing trading
- Watch for divergences: Often signal impending reversals
- Consider market context: Indicators work best when aligned with overall trend
Final Thoughts
These 10 leading indicators provide traders with valuable early signals about potential market movements. While no indicator is perfect, mastering a selection of these tools can:
- Improve entry/exit timing
- Enhance risk management
- Increase trading consistency