Below, we explore the 10 best support and resistance indicators, including Auto Fibonacci, Ichimoku Cloud, Pivot Points, and more.
Top 10 Support and Resistance Indicators
These indicators analyze price structure to detect reversal zones, enhancing trading precision.
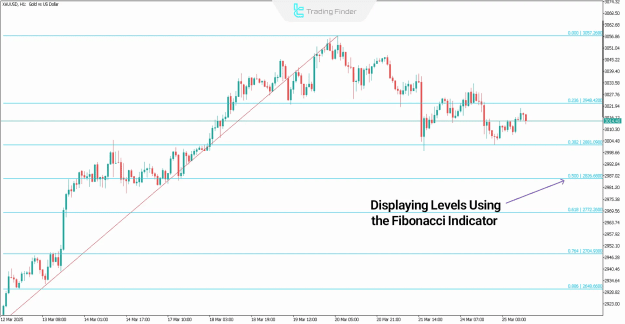
1. Auto Fibonacci Retracement Indicator
Fibonacci retracement levels act as hidden support and resistance zones within trends. The Auto Fibonacci Indicator automatically plots these levels, improving trade timing.
Available on:
- Auto Fibonacci Retracement Indicator MetaTrader 4
- Auto Fibonacci Retracement Indicator MetaTrader 5
- Auto Fibonacci Retracement Indicator TradingView
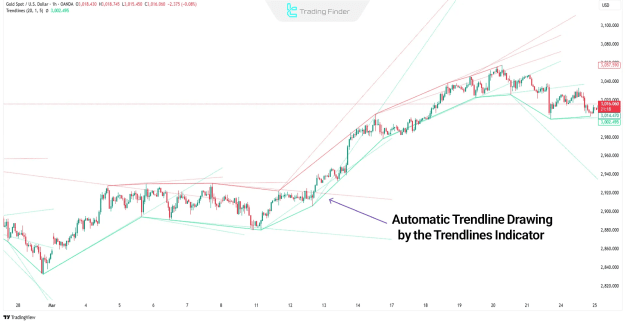
2. Trendlines Indicator
Trendlines provide dynamic support and resistance levels, helping traders identify market structure. The Trendlines Indicator auto-plots these lines for efficient analysis.
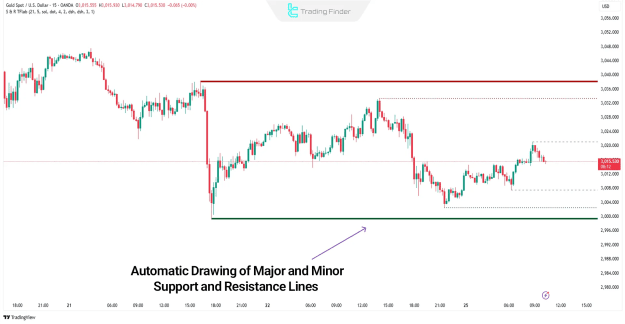
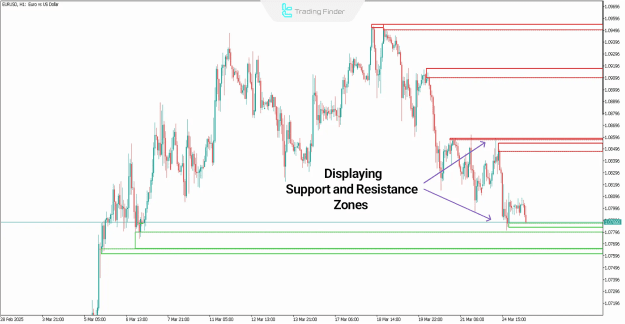
3. Support Resistance Major/Minor Indicator
This tool highlights major and minor support/resistance levels based on historical highs and lows, offering clear zones for potential reversals.
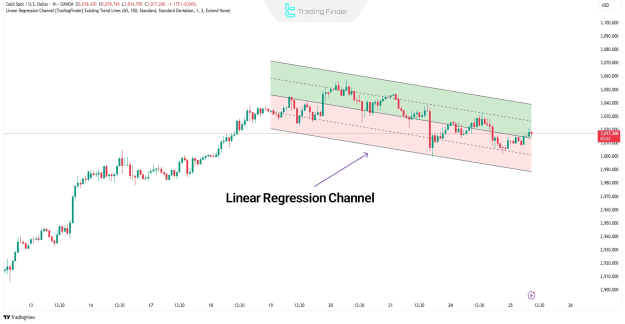
4. Linear Regression Channel Indicator
This indicator draws dynamic price channels, helping traders identify trend-based support and resistance levels.
Available on:
- Linear Regression Channel Indicator MetaTrader 4
- Linear Regression Channel Indicator MetaTrader 5
- Linear Regression Channel Indicator TradingView
5. Zone Indicator
The Zone Indicator marks historical support (green) and resistance (red) zones, improving reaction-level identification.
Available on:
- Zone Indicator MetaTrader 4
- Zone Indicator MetaTrader 5
- Zone Indicator TradingView
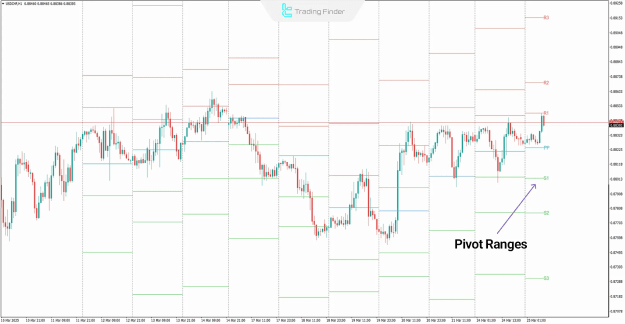
6. Pivot Point All-in-One Indicator
Pivot Points calculate key levels based on prior price action, offering strong support/resistance zones. Forex Pivot Points Calculator Tool by TradingFinder is freely available.
Available on:
- Pivot Points All-in-One Indicator MetaTrader 4
- Pivot Points All-in-One Indicator MetaTrader 5
- Pivot Points All-in-One Indicator TradingView
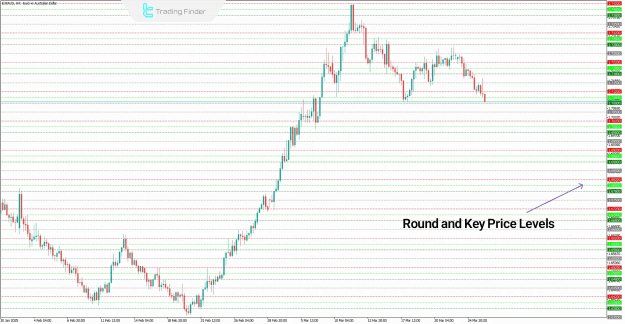
7. Key Price Action Level Indicator
This tool detects round-number levels and historical price action zones, acting as a supply/demand indicator.
Available on:
- Key Price Action Levels Indicator MetaTrader 4
- Key Price Action Levels Indicator MetaTrader 5
- Key Price Action Levels Indicator TradingView
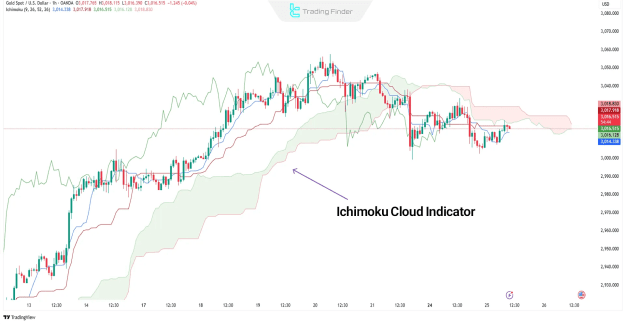
8. Ichimoku Cloud Indicator
The Ichimoku Cloud combines multiple elements to identify trends, support/resistance, and momentum.
9. Moving Average Indicator
Moving Averages (SMA/EMA) act as dynamic support/resistance levels, adaptable to any timeframe.
10. Donchian Channel Indicator
This indicator plots upper and lower bounds based on recent highs/lows, useful for breakout strategies.
Available on:
- MetaTrader 4
- MetaTrader 5
- TradingView
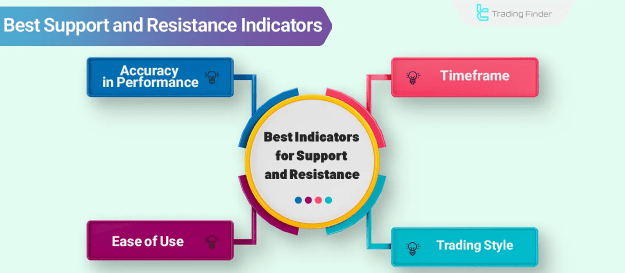
How to Choose the Best Support and Resistance Indicators?
Selecting the right indicator depends on:
1. Timeframe
- Short-term traders (scalpers): Use fast-reacting indicators (e.g., Pivot Points, Zone Indicator).
- Swing traders: Opt for 1H-4H chart indicators (e.g., Fibonacci, Trendlines).
- Long-term traders: Focus on daily/weekly indicators (e.g., Ichimoku, Moving Averages).
2. Trading Style
- Scalpers: Need quick, precise signals (e.g., Key Price Action Levels).
- Trend traders: Require dynamic levels (e.g., Donchian Channel, Linear Regression).
3. Ease of Use
Some indicators (e.g., Moving Averages) are beginner-friendly, while others (e.g., Ichimoku) require deeper understanding.
4. Accuracy & Backtesting
Always test indicators on historical data to confirm reliability. Combining multiple tools (e.g., Fibonacci + Pivot Points) improves accuracy.
Conclusion
The best support and resistance indicators depend on your trading strategy. Fibonacci, Pivot Points, and Moving Averages are highly effective, while Ichimoku and Donchian Channels suit advanced traders.
Choose indicators that align with your timeframe, style, and risk tolerance for optimal results.