What Is Top-Down Analysis?
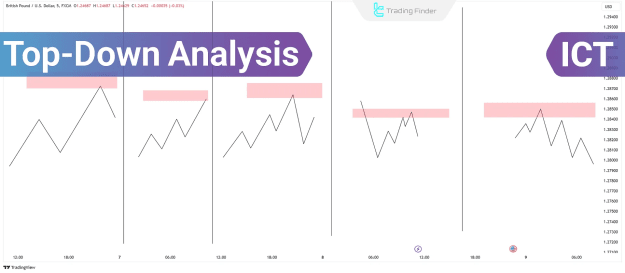
Top-Down Analysis involves assessing the market from broader timeframes (e.g., daily or 4-hour charts) to establish the dominant trend and critical price levels before transitioning to lower timeframes (e.g., 1-hour or 15-minute charts) for precise trade execution.
Key Benefits of Top-Down Analysis
- Clear Market Structure Interpretation – Identifies trends, support/resistance, and liquidity zones.
- Enhanced Trade Precision – Pinpoints high-probability entry and exit levels.
- Improved Risk Management – Aligns trades with higher timeframe bias, reducing false signals.
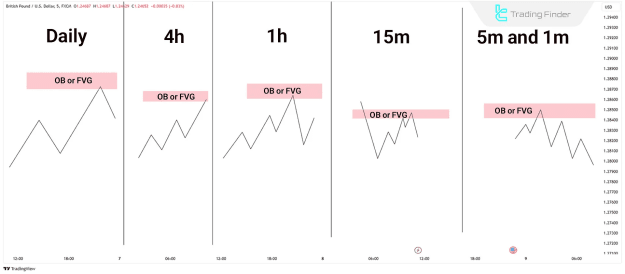
Step-by-Step Top-Down Analysis Framework
1. Daily Timeframe (D1) Analysis
The daily chart sets the foundation for market bias. Key steps include:
- Marking Order Blocks (OBs) and Fair Value Gaps (FVGs).
- Identifying major support/resistance and liquidity pools.
- Establishing the primary trend direction (bullish/bearish).
2. 4-Hour Timeframe (H4) Confirmation
The 4-hour chart refines the daily analysis by:
- Validating key levels from the D1 chart.
- Spotting session-based opportunities (e.g., New York Kill Zone).
- Observing FVG reactions or OB retests.
3. 1-Hour Timeframe (H1) Refinement
The 1-hour chart further confirms trade setups by:
- Assessing how price interacts with higher timeframe zones.
- Detailing market structure shifts (e.g., Break of Structure - BOS).
4. 15-Minute Timeframe (M15) for Entry Signals
The M15 chart provides actionable insights:
- Watching for liquidity grabs or displacement moves.
- Confirming FVG rejections or mitigation block reactions.
5. Lower Timeframes (M5 & M1) for Execution
The lowest timeframes fine-tune entries by:
- Triggering trades on market structure shifts (e.g., CHOCH - Change of Character).
- Utilizing FVG fills or liquidity sweeps for optimal risk-reward entries.
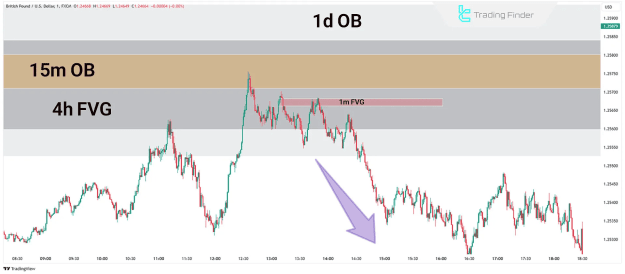
Practical Example of Top-Down Analysis
In a GBP/USD trade setup:
- The daily chart highlights a bullish order block.
- The 4-hour chart confirms an FVG reinforcing the bullish bias.
- The 1-hour chart shows a retest of a key support zone.
- The 15-minute chart reveals a liquidity sweep before a reversal.
- The 5-minute chart triggers an entry on a BOS confirmation.
Conclusion
Top-Down Analysis is a powerful ICT trading strategy that enhances decision-making by aligning trades with higher timeframe trends. By systematically analyzing from D1 down to M1, traders gain a holistic market perspective, leading to higher accuracy and reduced risk.
Implementing this structured approach ensures disciplined trading, optimizing entries while maintaining strong risk management principles.