Particularly for Forex education, TradingView offers robust features that cater to both novice and experienced traders. We will explore key functionalities such as customizable charts, technical indicators, drawing tools, and community resources, all aimed at enhancing your trading strategy and decision-making process. By the end of this guide, you’ll be equipped with the knowledge to utilize TradingView to its full potential, improving both your trading speed and accuracy.
What is TradingView?
As discussed in the "What is TradingView?" article, TradingView is a robust financial tool that provides real-time asset price data through charts. Traders can leverage various features available on the platform to analyze financial markets effectively.
Registration and Account Login
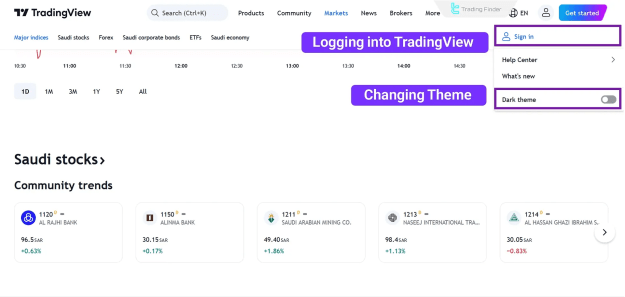
To log in to your account, click the designated icon in the top-right corner of the TradingView website. This will open a dropdown menu where you can select the "Sign In" button. A login form will prompt you for your email, username, and password. Alternatively, you can log in using LinkedIn, Twitter, Facebook, or other accounts.
If you do not have an account yet, click the "Get Started" button to create one. This process is straightforward and involves entering your email or linking your account to Google or Apple.
Once registered, you can choose to use the platform's free version or upgrade to premium versions for additional features.
The TradingView user interface is user-friendly, with drawing tools for technical analysis located on the left side, the price chart displayed centrally, and additional services accessible on the right.
Working with Charts and Searching for Trading Symbols
Charts are central to TradingView. The process of working with financial charts on this platform can be summarized in three steps:
- Search for the desired trading symbol (e.g., BTCUSD for Bitcoin, EURUSD for Forex).
- Select the chart's timeframe (ranging from 1 minute to monthly).
- Set the chart style (line, candlestick, Heiken Ashi, etc.).
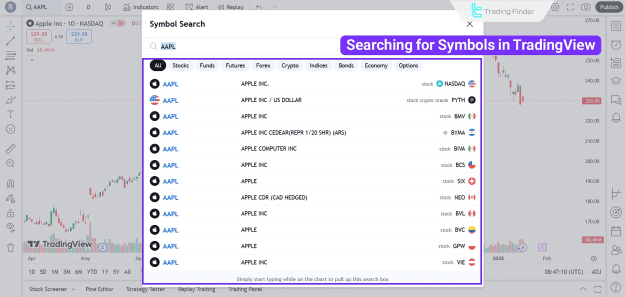
Searching for Trading Symbols
You can search and analyze various assets on TradingView. For instance, searching for "Ethereum" or "XAU" will yield multiple options for each asset, as TradingView provides price data from various Forex brokers and exchanges.
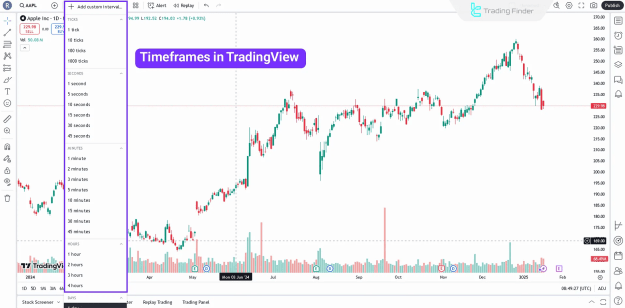
Selecting a Timeframe
Next, choose your desired trading timeframe in TradingView, which indicates the duration represented by each candlestick. This choice is influenced by whether you are a short-term trader (using hourly or minute timeframes) or a long-term investor (using daily or monthly timeframes).
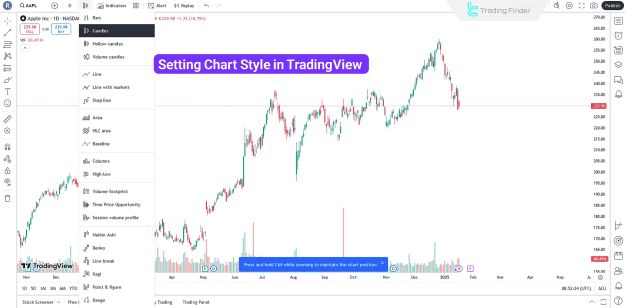
Setting the Chart Style
Select the chart style that aligns with your analysis needs. TradingView offers several chart types, including line, candlestick, Heiken Ashi, and hollow candles. If you do not have a preferred style, standard candlestick charts are generally recommended, as they are suitable for most trading strategies.
Technical Tools Offered by TradingView
Technical tools on TradingView include trendlines, Fibonacci retracements, chart patterns, and various indicators such as MACD, RSI, and Moving Averages. These tools facilitate the drawing of trendlines, channels, and price patterns.
- Fibonacci Tools:Fibonacci tools in TradingView assist in identifying support and resistance levels based on the Fibonacci sequence. They are also useful for determining premium and discount zones.
- Drawing Trendlines and Support/Resistance Levels: Trendlines and support/resistance levels are essential elements of technical analysis. TradingView's drawing tools simplify the process of adding these lines and levels to your charts, with extensive customization options available for each tool.
- Chart Patterns: With the drawing tools, you can create chart patterns like head and shoulders, triangles, or double tops on your chart. Tools for drawing harmonic patterns and Elliott waves are also accessible.
A Guide on Key Features and Tools of TradingView
In this section, we will explore several features of the platform that are beneficial to users, including:
- Trading Panel: The trading panel becomes available once you connect your TradingView account to your brokerage account. This feature allows you to trade directly through the platform. Additionally, the Paper Trading feature supports simulated trading, akin to demo trading on MetaTrader 4 and 5.
- Screener for Filtering Symbols: The Screener feature enables you to filter a list of assets based on various criteria, such as price, volume, and technical indicators.
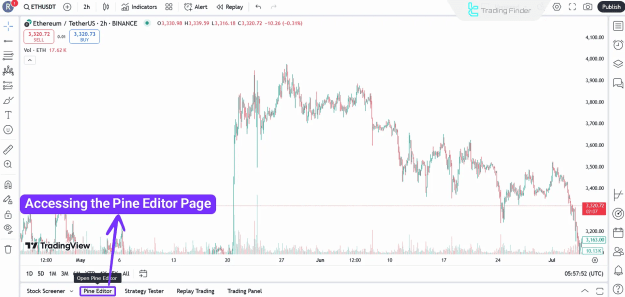
- Strategy Coding with Pine Script: Pine Script is a simple programming language that allows users to create custom indicators and trading strategies. After writing a script, you can evaluate its performance using the Backtesting tool.
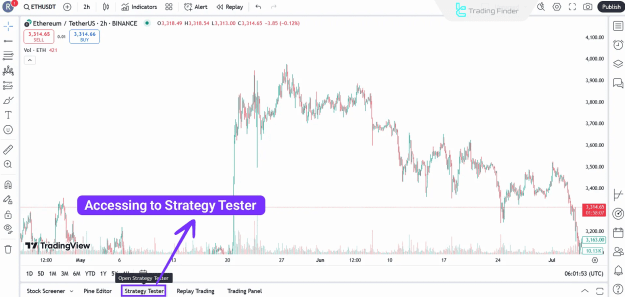
- Backtesting Trading Strategies: The Strategy Tester tool on TradingView allows users to backtest their trading strategies using historical price data.
- Access to the Trading Community: TradingView is more than just an analytical platform; it features an active community of traders. In the Trading Ideas section, users can share analyses and forecasts, providing inspiration and insights.
Additional Features of TradingView
Several noteworthy features enhance the TradingView experience, including:
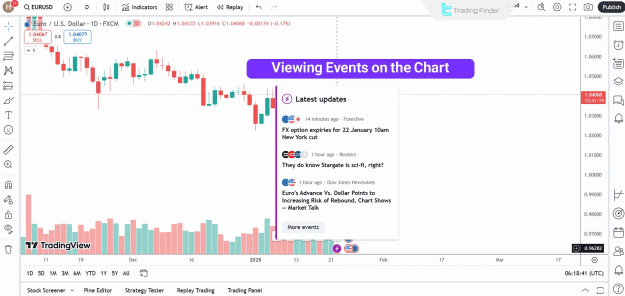
- The Events tool displays financial news and events directly on the chart.
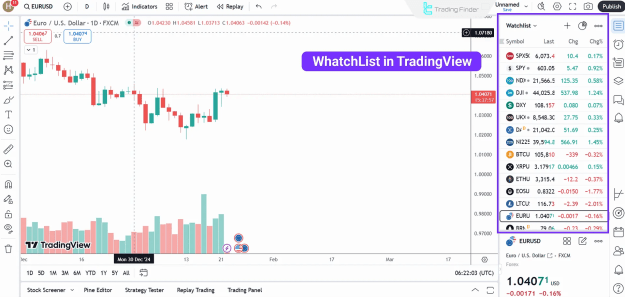
- The Watchlist saves your favorite symbols for monitoring price changes.
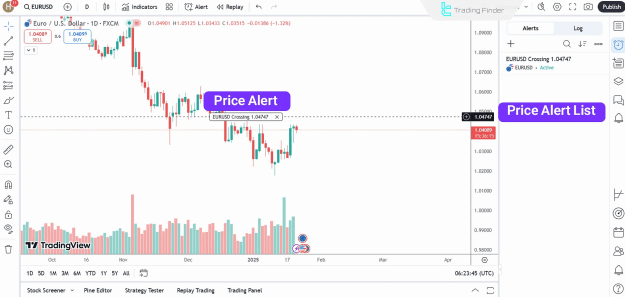
- Alerts allow users to receive notifications for specific conditions, such as when a price reaches a defined level.
Premium Versions of TradingView
While the basic version of TradingView offers numerous features for free, upgrading to premium plans unlocks advanced capabilities.
Tips for Optimizing Your Experience with TradingView
To maximize your use of TradingView, consider the following tips:
- Customize the interface to suit your preferences.
- Set price alerts to seize timely opportunities.
- Learn Pine Script to develop custom strategies and indicators.
- Engage with the community to share and gain insights.
Conclusion
This TradingView Tutorial has covered essential tools such as the Pine Editor, Strategy Tester, and Trading Panel, along with an overview of technical tools like Fibonacci, support/resistance levels, and chart patterns. Customizing your interface and setting price alerts are recommended for an optimal experience on the platform.