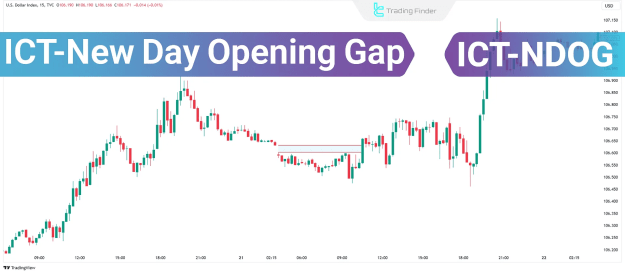
As part of advanced forex education, understanding NDOG is essential for traders seeking to capitalize on overnight price imbalances and early-session volatility.
Traders who utilize the ICT (Inner Circle Trader) methodology often incorporate NDOG to enhance their strategic entries and exits, particularly within forex markets, where session transitions play a critical role in price dynamics.
New Day Opening Gap (NDOG) Indicator:
New Day Opening Gap (NDOG) Indicator MT4
New Day Opening Gap (NDOG) Indicator MT5
Reasons for NDOG Formation
- Release of major economic news outside trading hours
- Sudden shifts in institutional order flow
- Changes in overall market supply and demand dynamics
These factors can trigger strong price reactions before the market reopens, leading to a gap.
Advantages of Using the NDOG Concept
- Multiple Trading Opportunities: Gaps occur frequently and create recurring setups across various sessions.
- Cross-Market Applicability: Effective in stocks, forex, indices, futures, and even cryptocurrencies.
- Predictable Price Behavior: Gaps often follow common fill or continuation patterns, enabling strategic positioning.
How to Apply NDOG at the Start of the Trading Day
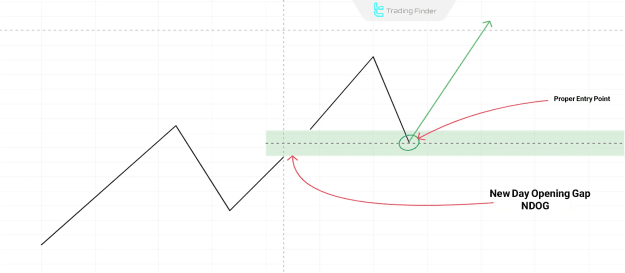
Step 1: Identify the NDOG
Mark both the previous day's closing price and the new day's opening price on your chart to define the gap zone.
Step 2: Analyze Price Reaction
- If the market attempts to fill the gap, consider a reversal or gap-fill strategy.
- If the price moves in the direction of the gap, look for confirmations that signal trend continuation.
Step 3: Enter the Trade
- For gap-fill strategies, enter against the direction of the gap.
- For trend-following strategies, enter with the gap’s direction after confirmation.
Step 4: Exit Strategy
Use key price levels or the origin of the gap to determine your stop-loss and take-profit points.
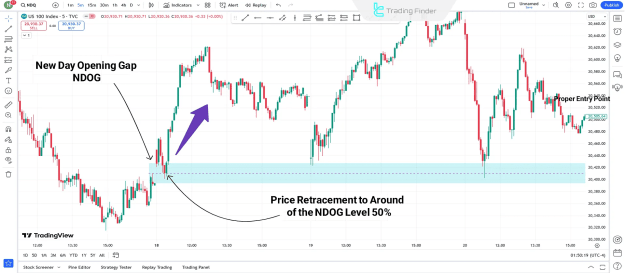
Using the 50% NDOG Level to Find Entries
The 50% midpoint of the NDOG is a critical reaction level in many trading setups. Traders use it as a decision point for entering or exiting trades.
- Apply the Fibonacci tool with levels set at 0, 0.5, and 1 to precisely mark the 50% zone.
- Monitor price reaction at this level for strong support or resistance.
NDOG Applications Across Market Structure
- Key Reference Levels: NDOG and NWOG levels often serve as support or resistance.
- Multi-Gap Analysis: Drawing five or more NDOG zones improves price pattern recognition.
- Intraday Entries: After spotting NDOG zones on daily charts, switch to lower timeframes (5-15 min) for refined entries.
Strategic Timing for NDOG-Based Trades
- First 1-2 hours of market open: Most reactive and volatile period for gaps.
- London Session: Increased volume and frequent gap-filling activity.
- New York Session: Gap continuation or major confirmation zone.
- Across Sessions: Different session behaviors impact gap dynamics significantly.
Advanced Tips for NDOG Strategy
- Multi-Day Gaps: Extended gaps spanning several days are highly significant.
- Unusually Large Gaps: These often result in stronger directional moves.
- Trend-Confluent Gaps: Gaps in the direction of the prevailing trend are statistically more successful.
- News-Based Gaps: Reactions caused by news or economic data tend to provide cleaner setups.
NDOG Buy Strategy in Bullish Conditions
Scenario 1: Price Opens Above the NDOG Level
- Wait for price to retrace and test the NDOG zone.
- Look for reversal signs or market structure shifts on lower timeframes.
- Enter a buy trade, targeting liquidity pools or recent highs.
Scenario 2: Price Opens Below and Closes Above NDOG
- A close above the NDOG level transforms it into support.
- Use this confirmation to validate bullish sentiment and consider buying opportunities.
NDOG Schematic in a Bullish Trend
On charts such as the Nasdaq (5-minute), NDOG can align with Fair Value Gap (FVG) principles in an uptrend, offering precise long entries when institutional price imbalances are corrected.
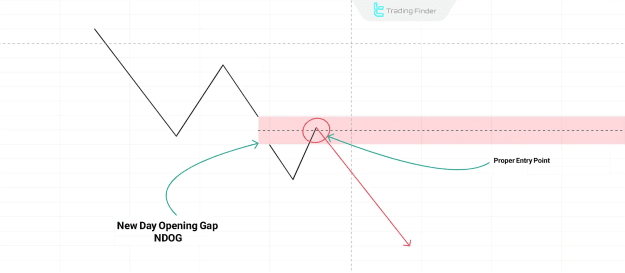
NDOG Sell Strategy in Bearish Conditions
Scenario 1: Price Opens Below NDOG Level
- Wait for a retest of the NDOG level.
- Observe structural breakdowns or rejection signs on lower timeframes.
- Enter a sell trade, targeting previous lows or liquidity zones.
Scenario 2: Price Opens Above and Closes Below NDOG
- A close below the NDOG zone designates it as resistance.
- This confirms bearish intent, signaling short-selling opportunities.
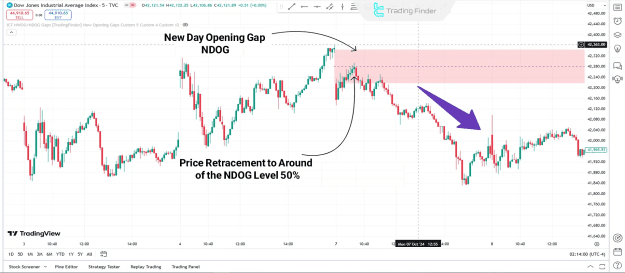
NDOG Schematic in a Bearish Trend
In a downtrend, NDOG acts similarly to a Fair Value Gap. The Dow Jones on a 5-minute chart often shows clean retracements into the NDOG zone before resuming the bearish move.
NDOG Comparison Across Financial Markets
Understanding how NDOG behaves in various asset classes helps refine trading models:
- Forex: High likelihood of gap fills, particularly at session open.
- Stocks: Gaps form daily, with moderate probability of retracement.
- Futures/Commodities: Regular gaps due to overnight/off-market hours.
- Indices: Gaps are common and often align with major market shifts.
- Cryptocurrencies: Less frequent gaps, though occasionally meaningful.
- Bonds: News-driven gaps with moderate reliability.
Conclusion
The New Day Opening Gap (NDOG) offers a simple yet powerful technique for identifying key market opportunities during daily opens. By tracking the behavior of price in relation to these gaps, traders can enhance decision-making during high-volatility periods.
While the concept is accessible, successful implementation depends on risk management, strategic discipline, and repeated practice.