What Is a Liquidity Sweep?
In ICT methodology, a liquidity sweep is a deliberate price movement designed to trigger stop orders or attract pending orders near key highs or lows. This typically precedes a reversal in market direction.
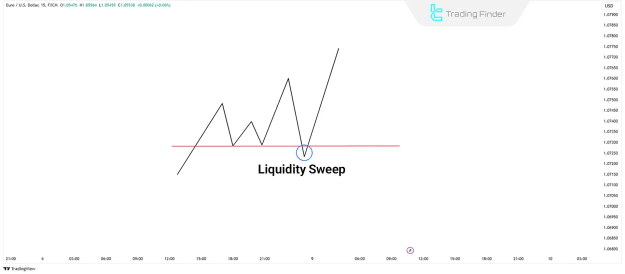
Characteristics of Bullish Liquidity Sweeps
- Price moves below equal lows to capture sell-side liquidity
- A sharp rejection or reversal follows without a sustained break
- Indicates the accumulation phase before a bullish rally
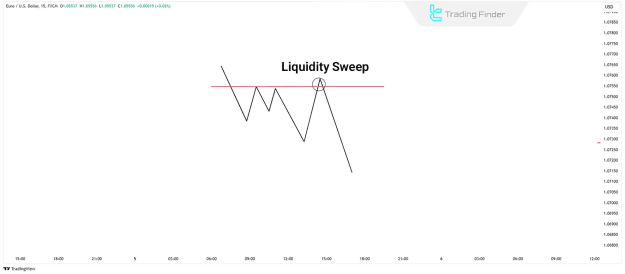
Characteristics of Bearish Liquidity Sweeps
- Price moves above equal highs to attract buy-side stop orders
- A rapid reversal downward follows
- Marks a distribution phase prior to a bearish move
How to Identify and Predict Liquidity Sweeps
Recognizing potential liquidity sweeps requires close observation of specific market behaviors. Key factors include:
- Equal Highs and Lows: Often targeted zones with clusters of stop orders
- Stop-Loss Clusters: Price typically moves towards areas with dense stop orders
- False Breakouts: Sudden moves that fail to hold above or below a key level
- Spike in Volume: Increased volume near support/resistance may signal liquidity absorption
- Reversal Candlestick Patterns: Pin bars, engulfing patterns, and wicks near liquidity zones
- Market Timing: These events commonly occur during the London or New York session openings
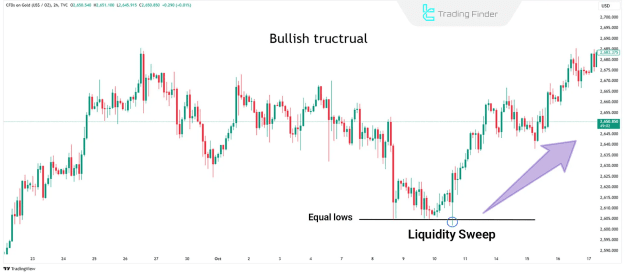
Buy Trades During Liquidity Sweeps
- In a bullish structure, when equal lows are visible, a sweep below these levels followed by a swift upward movement offers a potential long entry.
- For example, the XAU/USD pair on the 2-hour chart demonstrates how price reverses sharply after taking out sell-side liquidity.
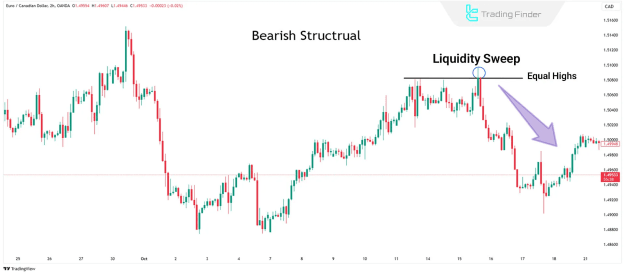
Sell Trades During Liquidity Sweeps
- In a bearish market, a price sweep above equal highs followed by a downward reversal presents a valid short entry opportunity.
- The EUR/USD 2-hour timeframe showcases how the market manipulates buy-side liquidity before continuing lower.
What Is a Liquidity Run?
A liquidity run refers to a price movement that targets liquidity in the direction of the prevailing trend and continues further after absorbing that liquidity. It typically signals a break of structure (BOS) and a trend continuation.
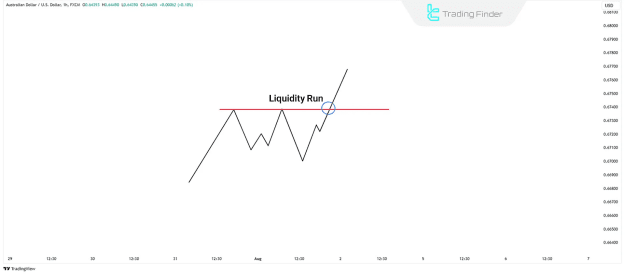
Bullish Liquidity Run
- Price targets a previous high, absorbs buy-side liquidity, and continues upward
- Establishes a new high, confirming the uptrend
- Represents a momentum-driven breakout
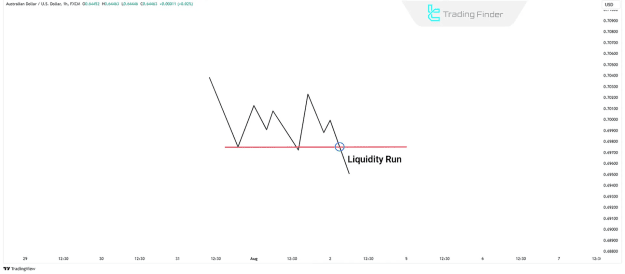
Bearish Liquidity Run
- Price reaches a prior low, absorbs sell-side orders, and pushes lower
- Forms a new lower low, reinforcing the downtrend
- Reflects strong bearish continuation
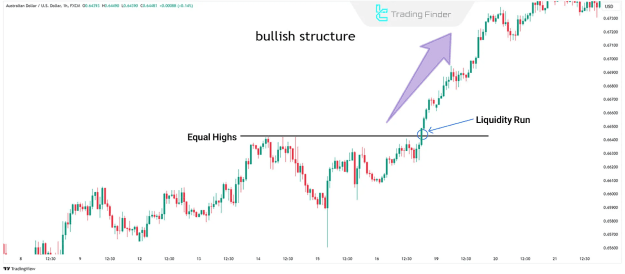
Buy Trades in Liquidity Runs
- In a bullish trend, when equal highs are formed, price may break those highs, absorb liquidity, and proceed higher.
- The AUD/USD 1-hour chart illustrates a clear liquidity run, providing an ideal setup for long positions.
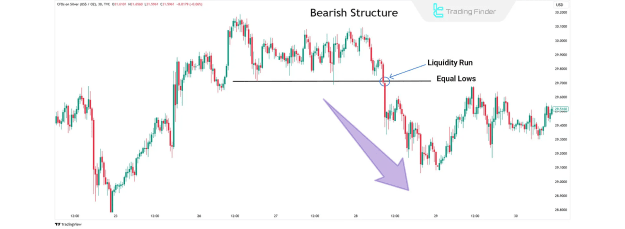
Sell Trades in Liquidity Runs
- In a bearish trend, the market may break below equal lows, trigger stops, and accelerate downward.
- The XAG/USD 30-minute chart exemplifies a liquidity run aligned with trend direction, offering a reliable short entry.
Conclusion
Understanding the concepts of Liquidity Sweep and Liquidity Run within the ICT (Inner Circle Trader) and Smart Money framework is essential for analyzing market liquidity behavior.
These strategies manifest differently based on market conditions and the prevailing trend—whether bullish or bearish.
When combined, they offer powerful insights for identifying optimal entry and exit points, enhancing overall trading precision.