Quasimodo Pattern (QM Pattern) Indicator:
Quasimodo Pattern (QM Pattern) Indicator MT4
Quasimodo Pattern (QM Pattern) Indicator MT5
What Is the Quasimodo (QM) Pattern?
Also referred to as Over and Under, the QM pattern comprises five distinct phases that reveal a potential change in market direction. This formation signals the exhaustion of the current trend and the beginning of a reversal.
Structure of the QM Pattern:
- Formation of an initial high (or low)
- A new low (or high) is created, opposite to the first point
- Price breaks beyond the previous level, forming a Higher High (HH) or Lower Low (LL)
- A significant pullback occurs, creating a new low (or high), which is lower (or higher) than the previous one
- Price then retraces to the original level but fails to break it
The key reversal signal occurs when the market fails to continue its previous trend and instead respects a key level, confirming a shift in momentum.
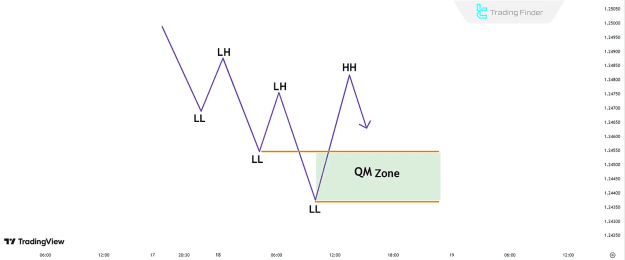
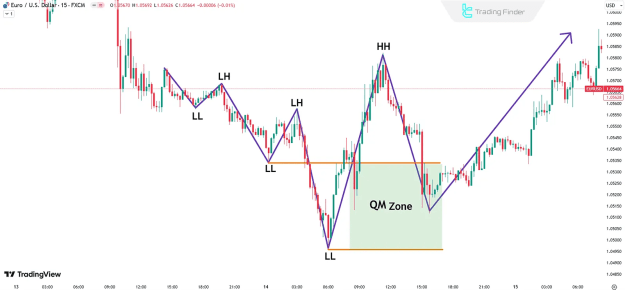
Quasimodo Pattern in a Downtrend
When appearing in a downtrend, the QM pattern indicates the possible beginning of a bullish reversal. Traders observe a sequence where each high (H) and low (L) plays a critical role in confirming the reversal structure.
Steps to Identify the QM Pattern
To correctly recognize the QM pattern, traders should follow these guidelines:
- Analyze the preceding trend (either upward or downward)
- Observe the market structure, especially how price reacts at critical levels
- Identify when price returns to a former level without breaking it, suggesting a strong rejection
- Look for clear higher highs or lower lows, followed by opposing movement
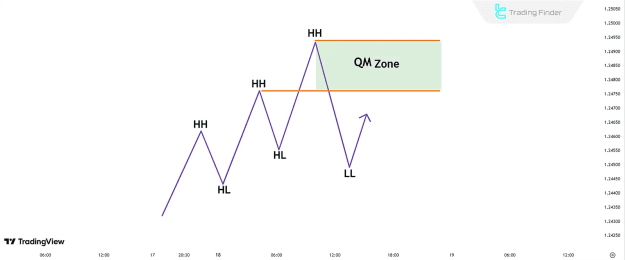
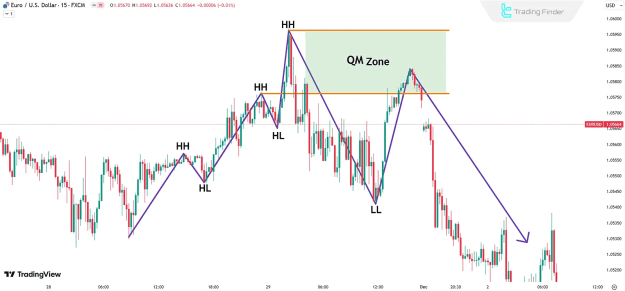
Quasimodo Pattern in an Uptrend
In an uptrend, the QM pattern presents a potential bearish reversal. The market forms a Higher High (HH), followed by a Lower Low (LL), and retraces to the HH zone without breaking it, which often acts as a resistance level for a sell entry.
How to Trade the QM Pattern
To effectively trade using the QM pattern, traders should incorporate the following steps:
1. Determine the Current Trend
Identify whether the market is trending upward or downward.
2. Identify Key Levels
Focus on important highs and lows where the price made significant movements. These levels form the QM zone, where entries typically occur.
3. Execute Trade Based on Pattern
- Sell Trade: Enter near the retracement of the high, when the price fails to break the previous high.
- Buy Trade: Enter near the retracement of the low, when the price fails to break the previous low.
4. Risk Management
- Stop-Loss: Set above the high for sell trades or below the low for buy trades
- Take-Profit: Use a risk-reward ratio, commonly 1:3, to determine target levels
Practical Example: QM Pattern in Action
In a real scenario within an uptrend, observe the following sequence:
- The price makes a High (H) followed by a Low (L)
- It then creates a Higher High (HH)
- The market drops, forming a Lower Low (LL)
- Price retraces to the original High but does not break it
At this stage, a sell trade can be initiated, with the stop-loss placed just above the HH.
Real Example: QM Pattern in a Downtrend
In a downtrend scenario, the same pattern unfolds in reverse:
- Formation of Lower Lows and Lower Highs
- Market creates a Higher Low, then returns to the initial level
- A bullish reversal becomes likely if the retracement fails to breach the prior low
Key Tips for Using the QM Pattern Effectively
- Combine the QM pattern with supply and demand zones for better accuracy
- Avoid patterns with extremely wide highs and lows, as this reduces the risk-to-reward efficiency
- Use additional confirmations such as divergence, price action signals, or support/resistance zones
Conclusion
The Quasimodo (QM) pattern is a high-probability reversal strategy used in RTM-style price action trading. Its structured approach to identifying market structure shifts provides traders with strategic entry opportunities and sound risk management potential.
Applicable across multiple timeframes and financial markets, this pattern is a valuable tool for traders seeking low-risk, high-reward setups grounded in pure price behavior.