The Hidden SMT Divergence Indicator (MT5) is an advanced MetaTrader 5 tool that detects subtle divergences between three correlated stock indices (DJI, SP500, ND100) using ICT Smart Money concepts. By analyzing relative strength/weakness across these instruments, it identifies potential trend reversals and liquidity shifts before they occur.
You can download it from this link:
https://cdn.tradingfinder.com/file/2...5-by-tflab.zip
You can also access the MetaTrader 4 version of this indicator through this page:
https://www.cryptocraft.com/thread/1...ey-correlation
For instructions on how to install:
https://www.forexfactory.com/thread/...-in-metatrader
 Key Specifications
You can download it from this link:
https://cdn.tradingfinder.com/file/2...5-by-tflab.zip
You can also access the MetaTrader 4 version of this indicator through this page:
https://www.cryptocraft.com/thread/1...ey-correlation
For instructions on how to install:
https://www.forexfactory.com/thread/...-in-metatrader
Inserted Video
- Category: ICT - Smart Money - Liquidity
- Platform: MetaTrader 5
- Skill Level: Advanced (ICT Knowledge Required)
- Indicator Type: Reversal & Continuation
- Timeframe: Multi-Timeframe (M15-H4 Recommended)
- Trading Style: Intraday & Swing Trading
- Markets: Crypto, Stocks (DJI, SP500, ND100), Indices
![]() Trading Signals Explained
Trading Signals Explained
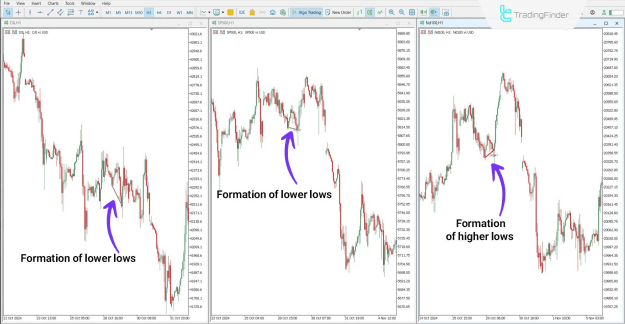
Bullish Divergence Pattern
- Scenario: DJI/SP500 make lower lows while ND100 forms higher lows
- Interpretation: Smart Money accumulating ND100 despite broader weakness
- Action: Potential long opportunity in ND100
- Visual: Green divergence lines connecting swing points
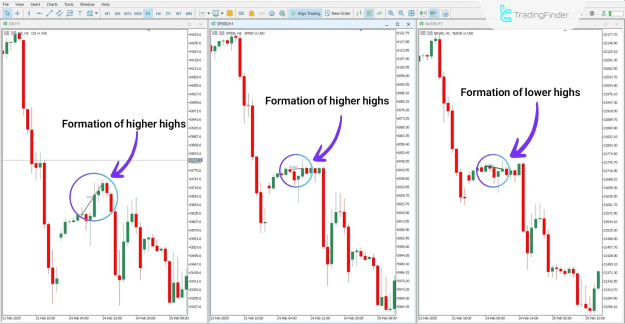
Bearish Divergence Pattern
- Scenario: DJI/SP500 show higher highs while ND100 prints lower highs
- Interpretation: Institutional distribution in ND100
- Action: Consider short positions in weaker index
- Visual: Red divergence markers highlighting price discrepancies
![]() Optimal Configuration
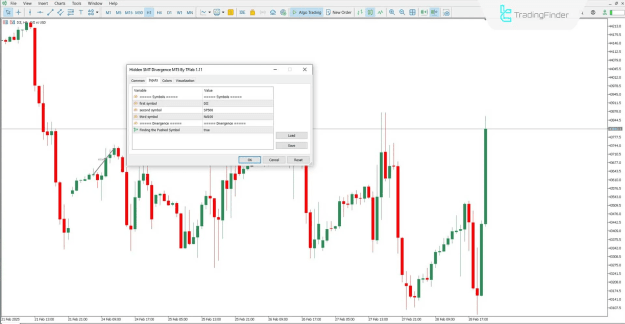
Optimal Configuration
- Symbol Setup:
- First Symbol: DJI (Primary benchmark)
- Second Symbol: SP500 (Correlated index)
- Third Symbol: ND100 (Tech-heavy comparator)
- Detection Settings:
- Swing Point Sensitivity: 2-3 candles for intraday
- Auto Pushed Symbol: Enabled for weakest/strongest detection
- Visual Preferences:
- Line Colors: Customizable for clear differentiation
- Alert Types: Popup/Sound for divergence confirmation
![]() Pro Trading Strategies
Pro Trading Strategies
- Liquidity Grab Confirmation:
- Wait for divergence + FVG (Fair Value Gap) alignment
- Enter on retest of identified liquidity zone
- Session-Based Trading:
- NYSE Open (09:30 EST) often shows clearest divergences
- Combine with volume profile for confirmation
- Multi-Timeframe Analysis:
- H1 for primary trend
- M15 for precise entries
![]() Important Notes
Important Notes
- Must be applied to First Symbol's chart initially
- Works best with correlated assets (avoid mixing unrelated instruments)
- Requires 3+ months of backtesting for optimal parameter tuning
![]() Why Traders Choose This Tool
Why Traders Choose This Tool
- Identifies institutional order flow through intermarket analysis
- Provides early warnings of sector rotations
- Visualizes relative strength between major indices
- Complements other ICT tools like Kill Zones/Liquidity Pools
This indicator transforms complex intermarket analysis into clear, actionable signals - giving retail traders institutional-grade insight into index relationships.
Attached Image(s) (click to enlarge)