{quote} how u got those signals , could u plz explain and help new traders
Ignored
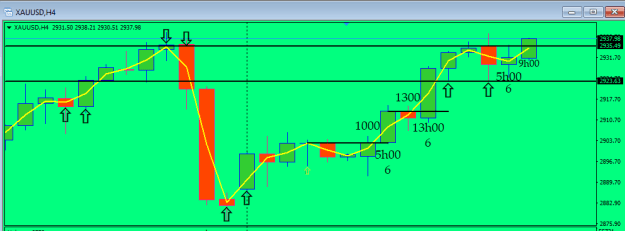
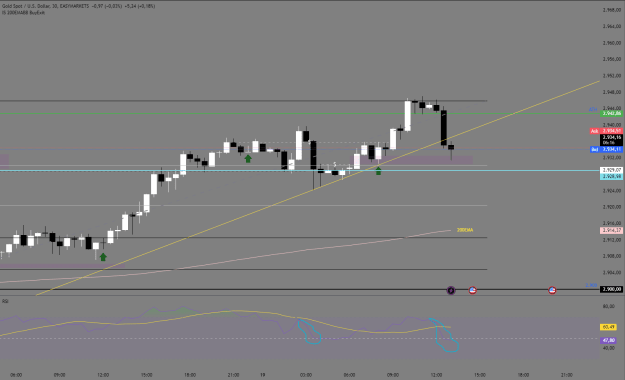
Pretty good example why thrust bars work. They're nothing more than pullbacks which test lower levels (or to take out stop losses); returning back to the trend that's in place. See below
{quote} Pretty good example why thrust bars work. They're nothing more than pullbacks which test lower levels (or to take out stop losses); returning back to the trend that's in place. See below {image} Hope this helps BDfx!!
Ignored
Note where the levels been drawn and check the point where the bars(candles) stopped their retreat - and turning back again. This occur on any TF. So, its a good idea for inexperienced traders to be on the lookout for this before embarking on a trade.
{quote} Note where the levels been drawn and check the point where the bars(candles) stopped their retreat - and turning back again. This occur on any TF. So, its a good idea for inexperienced traders to be on the lookout for this before embarking on a trade.
Ignored
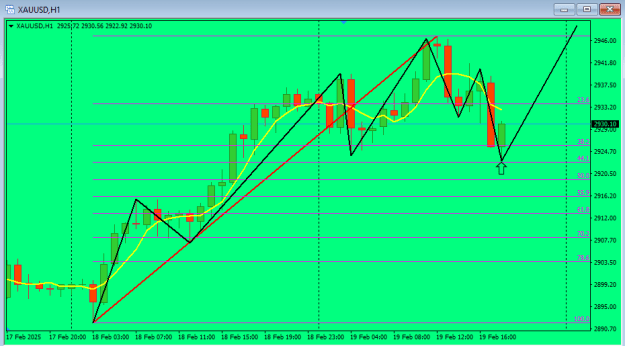
This will also help in doing the candle count as the structure of the formation is more obvious.
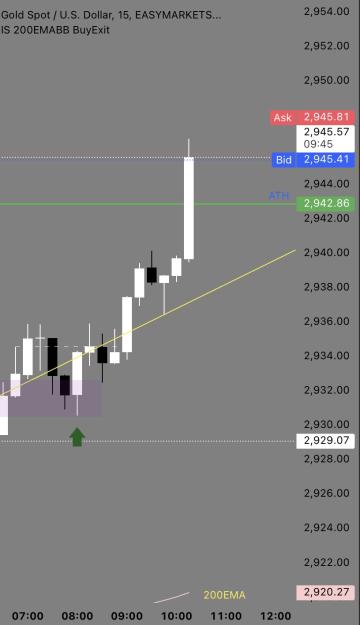
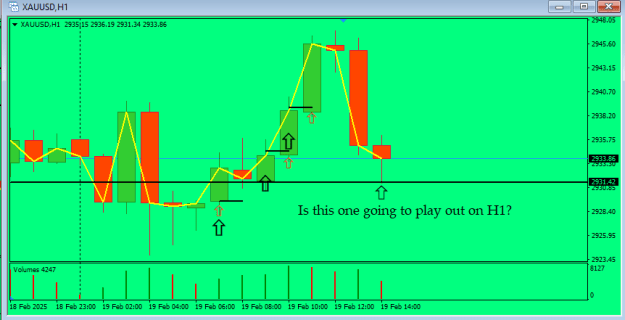
Gold seems to want to cool down on the RSI, if it doesn't drop to low down on the RSI (I'd say to about 30 at most) it could just be a preperation for continuous upward momentum. Would love to hear ya'lls opinions on that.
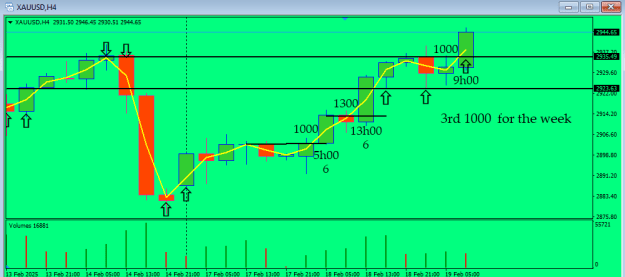
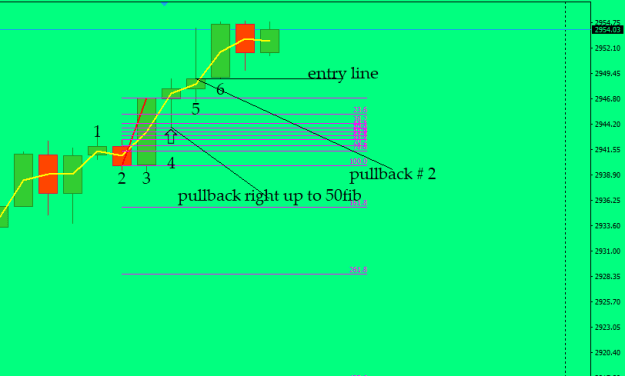
A formation consists 9 out of 10 times of 6 candles and can be seen as steps in a staircase. let's take the above screenshot as an example: {image} The count starts off from a recent low. We start counting where the color has changed and it ends with the entry candle. Take note that sometimes you will have to count in the candle just before the change to get to the final candle (6) which is the trade candle)
Ignored
Hi. How did you arrive at the number "6"? I mean, why not 5 or 7? I don't understand the basic assumption behind this number of candles and why it would be the same on every chart's timeframe. Is that simply because, according to your "tests" (if there are any), that is the best probability for a successful trade from X number of X setups on X timeframe on X market. Do you have any statistics for this "system" or can I rather assume that this is not a "system" in the classic sense but simply an individual trade trigger/signal without any context for risk/goal management?
As a side note, I am a total noob, especially when it comes to price action trading and reading charts (but interested in learning if it could somehow help me achieve my goals).
{quote} Hi. How did you arrive at the number "6"? I mean, why not 5 or 7? I don't understand the basic assumption behind this number of candles and why it would be the same on every chart's timeframe. Is that simply because, according to your "tests" (if there are any), that is the best probability for a successful trade from X number of X setups on X timeframe on X market. Do you have any statistics for this "system" or can I rather assume that this is not a "system" in the classic sense but simply an individual trade trigger/signal without any...
Ignored
I can't spoon fed everyone who turn up here, if you can't get to grips doing the candle count it's your problem.
{quote} Hi. How did you arrive at the number "6"? I mean, why not 5 or 7? I don't understand the basic assumption behind this number of candles and why it would be the same on every chart's timeframe. Is that simply because, according to your "tests" (if there are any), that is the best probability for a successful trade from X number of X setups on X timeframe on X market. Do you have any statistics for this "system" or can I rather assume that this is not a "system" in the classic sense but simply an individual trade trigger/signal without any...
Ignored
Why then rather try the pullback option; or will you require a test too in this case? You can test it yourself.
{quote} Why then rather try the pullback option; or will you require a test too in this case? You can test it yourself.
Ignored
Hehe. I didn't say anything about that. I don't even know what a pullback option is.
No, I'm just trying to understand whether this is a specific trading system or how you can make one out of it that can be traded systematically and profitably by repeatedly carrying out a series of clear steps. Reading a formation/pattern on the chart seems to play the smallest role. For example, I wouldn't know at what times I should look, how much time this "observation" would cost me every day, how many trades I should make/expect, how I should determine my risk/profit target for such a trade. In short, how I do this as a business and not as a hobby gambler who does something here and there somewhere without a plan and probably doesn't even have a goal of achieving a certain minimum result in the form of X return in X period of time.
Being spoon fed. No, I can hold the spoon myself if I know what to do with it to achieve a certain goal. I'll keep reading here. Maybe it will help me somehow. Thanks.
Joined Jun 2011
|
Status: Trader
|17,007 Posts|
Online Now
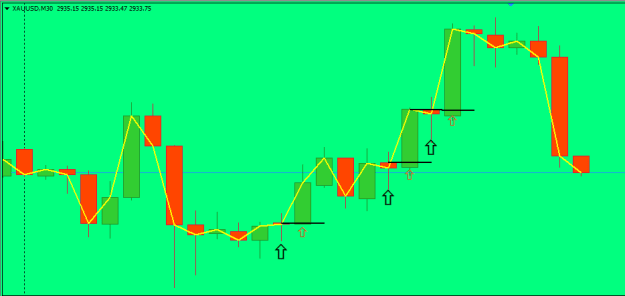
Why does the count start here? I'm going to say this for the last time! IF YOU DON'T GET 6 UP TO THE TRADE LINE, YOU NEED TO COUNT THE CANDLE BEFORE COLOR CHANGE as well. It all depends on where the entry line was set. And why is the trade line been set there? Because there was a big pullback.