My strategy works based on moving averages with fibonacci period ,i set the fibonacci
levels on moving averages period and you can see nice moves ,im here to share
my experiences on this system for you so dont be hesitate if have any
question.
This strategy is good for Eur/Usd, Gbp/Usd, Usd/Jpy, Usd/Chf
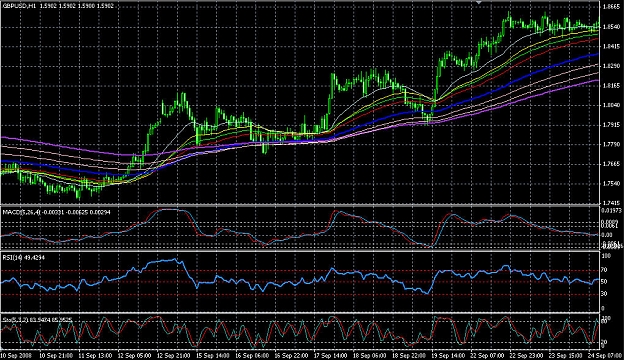
Here is the chart formation :
Eight exponential Moving average apply to close
1- period 200 DarkOrchid
2- period 161 shift 2 Pink
3- period 130 shift 2 pink
4- period 100 shift 1 Blue
5- period 61 shift 1 Red
6- period 50 Lime
7- period 38 shift 2
8- period 23 shift 1
and Then
MACD 5Fma,26SEma,4SSma add three levels 0 and (+0.0061 and -0.0061 for eur/usd)
to assign levels to another currencies
RSI period 14 apply to close with three levels 30,50,70
stochastic Oscillator 5,3,2
Your chart should be like this :
http://www.forexfactory.com/attachme...1&d=1225032635
ok now you have got your chart configuration and setup your chart its time to
find entry point.
you can use this strategy on any time frame , Daily, Weekly ,4 hours ,
1 hours or even 30mins or 15mins ,but the important point is when you want
to enter the market for example on 1 hour chart then you must have
confirmation from higher time frame in this example 4 hours and Daily charts.
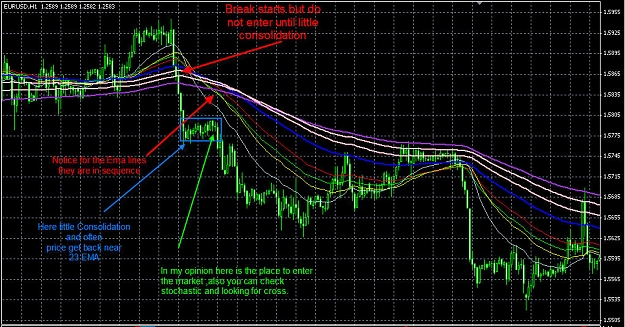
---------I give you an example on 1 hour chart for entry.
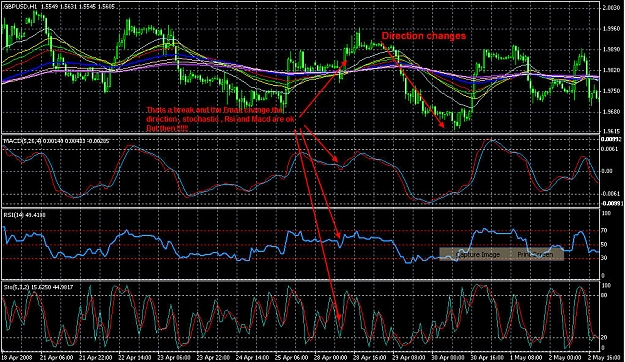
1-First Rule and most important is the TREND is our FRIEND so be Trend's
Friend.
To identify the trend simply check the both 4hours and daily time frame
if the price is at bottom of the 23Ema on three charts (1h ,4h ,Daily) then
the trend down exactly vise versa for uptrend.
2-The moving averages must be in sequence ,when you looking at chart first 23
then 38 then 50 , 61 , 100 (130 and 161 and 200 not important in sequence)
3- Now we go to 1H chart to find entry point
Here we have three conditions :
A: Break out
In chart you can see price break out from up to down ,do not even think
about enter the market until you see little consolidation ,let some fresh air.
Check the price if the move is more than 150 pips on euro and macd is under
-0.0061 level then its may be some risky !!!! in this situation you can wait
until price touch 23 Ema or become very near this line.
Here these are the MACD levels and break pips for currencies.
Eur/Usd = +0.0061 and -0.0061 , 150pips
Gbp/Usd = +0.0089 and -0.0089 , 250pips
Usd/Jpy = +0.61 and -0.61 , 200pips
Usd/Chf = +0.0061 and -0.0061 , 150pips
the price have to near or not to far from 23Ema.
http://www.forexfactory.com/attachme...1&d=1225033084
http://www.forexfactory.com/attachme...1&d=1225033084
Another conditions and entries on next steps please wait and be patience.
Have good trades.
levels on moving averages period and you can see nice moves ,im here to share
my experiences on this system for you so dont be hesitate if have any
question.
This strategy is good for Eur/Usd, Gbp/Usd, Usd/Jpy, Usd/Chf
Here is the chart formation :
Eight exponential Moving average apply to close
1- period 200 DarkOrchid
2- period 161 shift 2 Pink
3- period 130 shift 2 pink
4- period 100 shift 1 Blue
5- period 61 shift 1 Red
6- period 50 Lime
7- period 38 shift 2
8- period 23 shift 1
and Then
MACD 5Fma,26SEma,4SSma add three levels 0 and (+0.0061 and -0.0061 for eur/usd)
to assign levels to another currencies
RSI period 14 apply to close with three levels 30,50,70
stochastic Oscillator 5,3,2
Your chart should be like this :
http://www.forexfactory.com/attachme...1&d=1225032635
ok now you have got your chart configuration and setup your chart its time to
find entry point.
you can use this strategy on any time frame , Daily, Weekly ,4 hours ,
1 hours or even 30mins or 15mins ,but the important point is when you want
to enter the market for example on 1 hour chart then you must have
confirmation from higher time frame in this example 4 hours and Daily charts.
---------I give you an example on 1 hour chart for entry.
1-First Rule and most important is the TREND is our FRIEND so be Trend's
Friend.
To identify the trend simply check the both 4hours and daily time frame
if the price is at bottom of the 23Ema on three charts (1h ,4h ,Daily) then
the trend down exactly vise versa for uptrend.
2-The moving averages must be in sequence ,when you looking at chart first 23
then 38 then 50 , 61 , 100 (130 and 161 and 200 not important in sequence)
3- Now we go to 1H chart to find entry point
Here we have three conditions :
A: Break out
In chart you can see price break out from up to down ,do not even think
about enter the market until you see little consolidation ,let some fresh air.
Check the price if the move is more than 150 pips on euro and macd is under
-0.0061 level then its may be some risky !!!! in this situation you can wait
until price touch 23 Ema or become very near this line.
Here these are the MACD levels and break pips for currencies.
Eur/Usd = +0.0061 and -0.0061 , 150pips
Gbp/Usd = +0.0089 and -0.0089 , 250pips
Usd/Jpy = +0.61 and -0.61 , 200pips
Usd/Chf = +0.0061 and -0.0061 , 150pips
the price have to near or not to far from 23Ema.
http://www.forexfactory.com/attachme...1&d=1225033084
http://www.forexfactory.com/attachme...1&d=1225033084
Another conditions and entries on next steps please wait and be patience.
Have good trades.
Attached Image(s) (click to enlarge)