The BUYSELL BUTTON_3 is an Expert Advisors built in an EA form and designed for 'manual trade' and does not trade on its own. By simply clicking the button for easy and quick execution of orders, this can work along side with your trades. The BUYSELL BUTTON_3 has 2 buttons (3-buy and 3-sell). The 3-SELLS and 3-BUYS buttons, each is for triple orders in a single entry, with TP and SL=500 as default, and Lotsizes are calculated and distributed by the ff. 1. max lots all multiplied by 40% goes to the first order with TP 15 pips. 2. max lots all multiplied...
Ignored
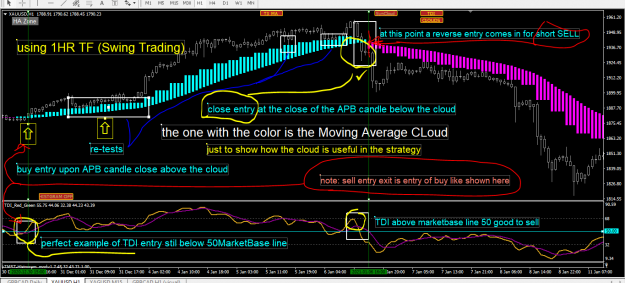
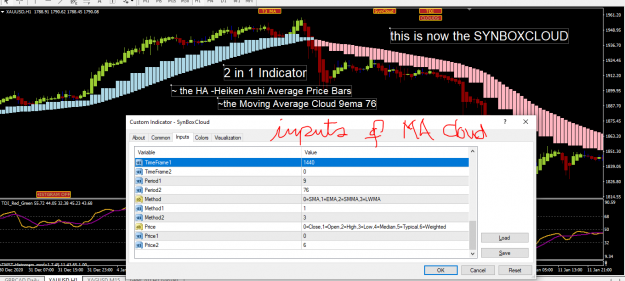
Indicators/OscillatorsSEE #POST 1. SynBoxCloud, a 2-in-1 Indicator/Oscillator with Average Price Bar and Cloud Moving Average and more. sample MA Cloud strategy and HA APB average price bars pro and not pro.
CLOUD STRATEGY WITH TDI
Attached Image (click to enlarge)
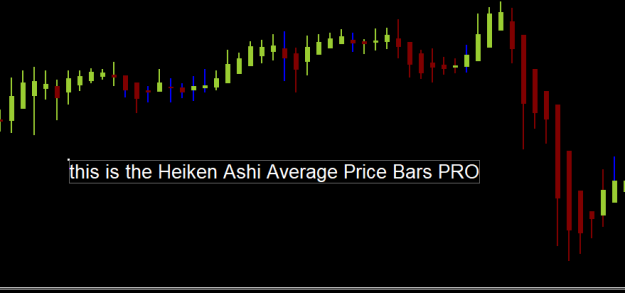
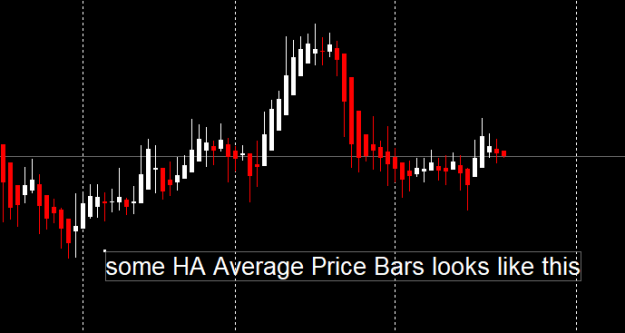
THE HEIKEN ASHI AVERAGE PRICE BARS PRO
Attached Image (click to enlarge)
MA CLOUD INPUTS
Attached Image (click to enlarge)
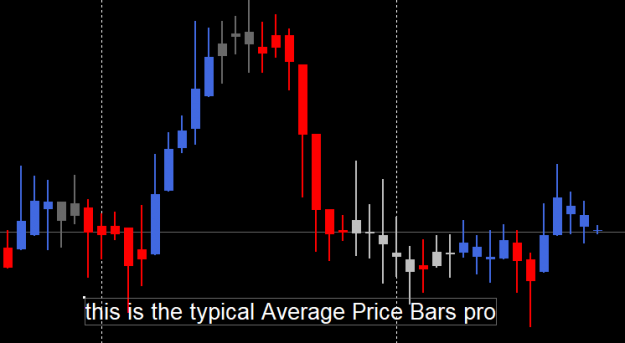
see also the differences of other indicators for HA APB between pro and non pro Indicators/Oscillators of heiken ashi average price bars
PRO HA APB
Attached Image (click to enlarge)
NON-PRO
Attached Image (click to enlarge)
for queries & request a trial version(for BUYSELL BUTTON_1_2_3), Inbox me here in FF.
May your pips come true. Happy Trading... Smile even if you loss but don't give up. Be blessed.
Disclaimer: JuliefaFX Technical Analysis, including autochartist services and contents, is provided for informational purposes only, and does not take into account any individual's personal circumstances, investment objectives, or risk tolerance. Past performance is not indicative of future results. Please conduct your own due diligence before stepping in.
{quote} Indicators/OscillatorsSEE #POST 1. SynBoxCloud, a 2-in-1 Indicator/Oscillator with Average Price Bar and Cloud Moving Average and more. sample MA Cloud strategy and HA APB average price bars pro and not pro. CLOUD STRATEGY WITH TDI {image} THE HEIKEN ASHI AVERAGE PRICE BARS PRO {image} MA CLOUD INPUTS {image} see also the differences of other indicators for HA APB between pro and non pro Indicators/Oscillators of heiken ashi average price bars PRO HA APB...
Ignored
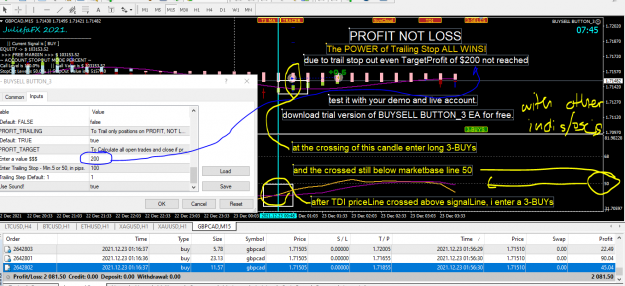
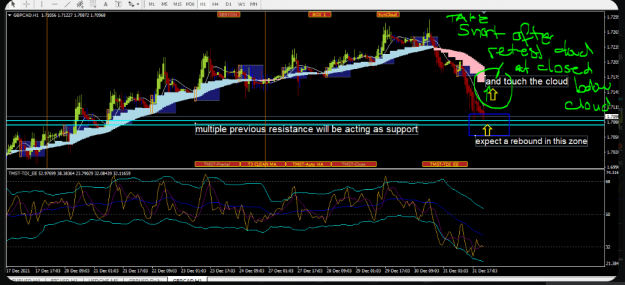
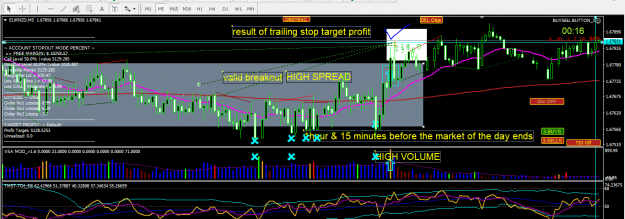
12/ 23/ 2021 UPDATE FOR GBPCAD with TDI and crossing of PA above T3 CLean (this time a bit of scalping as Day Trader)
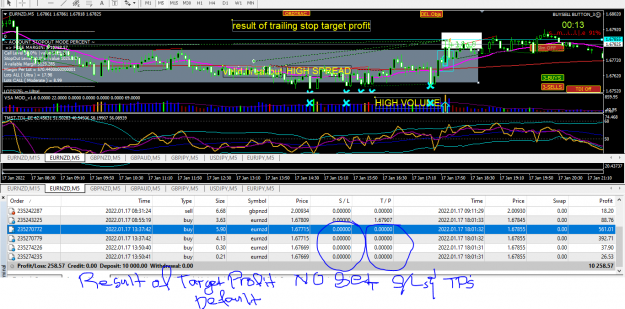
the trailing stop out breakeven move to TAKE PROFIT and NOT LOSS is working even if PROFIT TARGET = $200 NOT reached .
{quote} 12/ 23/ 2021 UPDATE FOR GBPCAD with TDI and crossing of PA above T3 CLean (this time a bit of scalping as Day Trader) the trailing stop out breakeven move to TAKE PROFIT and NOT LOSS is working even if PROFIT TARGET = $200 NOT reached . {image}
Ignored
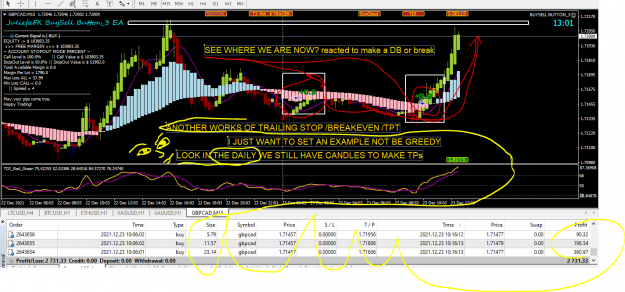
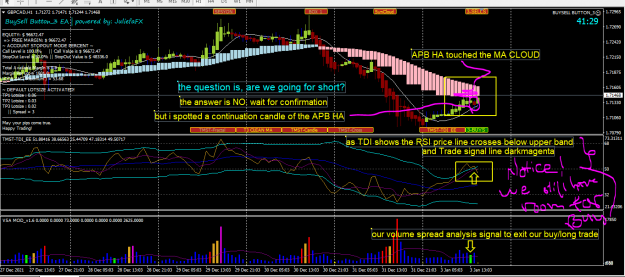
THE WORKS OF TRAILING STOP/BREAKEVN AND TARGET PROFIT GBPCAD UPDATE WE STILL HAVE MORE ROOMS FOR THE DAILY. TAKE ADVANTATE OF THE SIGNAL. RIDE WITH THE MMM
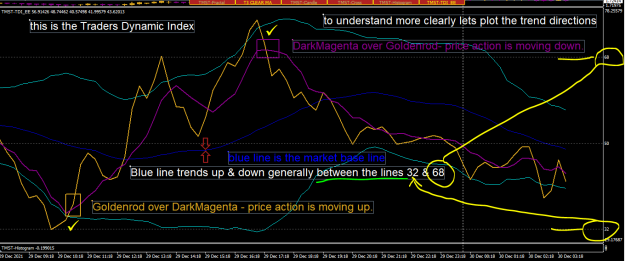
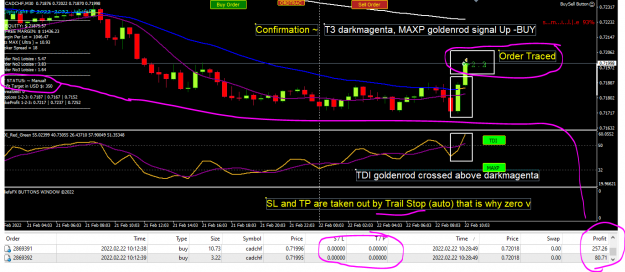
Goldenrod line = RSI Price line
DarkMagenta line = Trade Signal line
Cyan lines = Volatility Band
Blue line = Market Base Line
I. Trend Direction
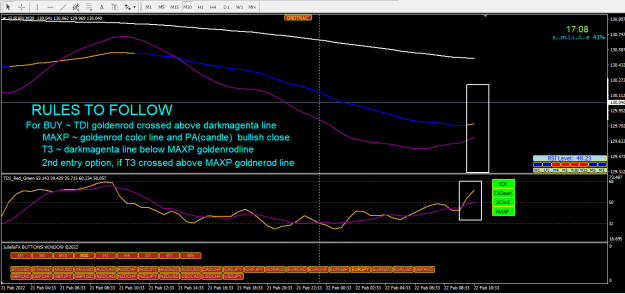
1. Goldenrod over DarkMagenta...price action is moving up.
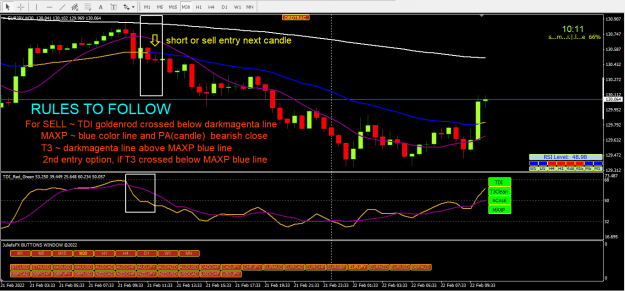
2. DarkMagenta over Goldenrod...price action is moving down.
Blue line trends up and down generally between the lines 32 & 68.
Watch for Blue line to bounces off these lines for market reversal.
Trade long when price is above the Blue line, and trade short when price is below.
II. Market Strength & Volatility
A. Goldenrod Line
1. Strong = Steep slope up or down.
2. Weak = Moderate to Flat slope.
B. Cyan Lines
1. When expanding - market is strong and trending.
2. When constricting - market is weak and in a range.
3. When the Cyan lines are extremely tight in a narrow range, expect an economic announcement or other market condition to spike the market.
III. Entry and Exit
A. Entry conditions
1. Scalping
1.a. Long = Goldenrod over DarkMagenta
1.b. Short = DarkMagenta over Goldenrod
2. Active
2.a. Long = Goldenrod over DarkMagenta & Blue lines
2.b. Short = DarkMagenta over Goldenrod & Blue lines
3. Moderate
3.a. Long = Goldenrod over DarkMagenta, Blue, & 50 lines
3.b. Short= DarkMagenta over Goldenrod, Goldenrod below Blue & 50 line
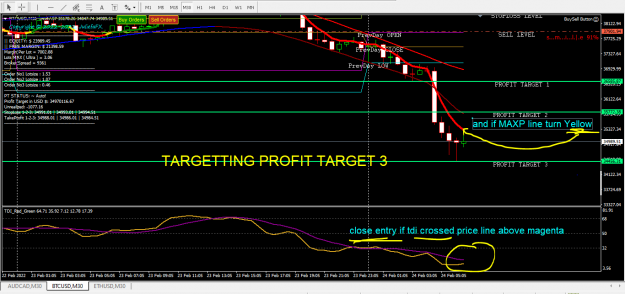
B. Exit conditions *
1. Long = Goldenrod crosses below DarkMagenta
2. Short = Goldenrod crosses above DarkMagenta
* If Goldenrod crosses either Cyan lines, consider exiting when
when the Goldenrod line crosses back over the Cyan line.
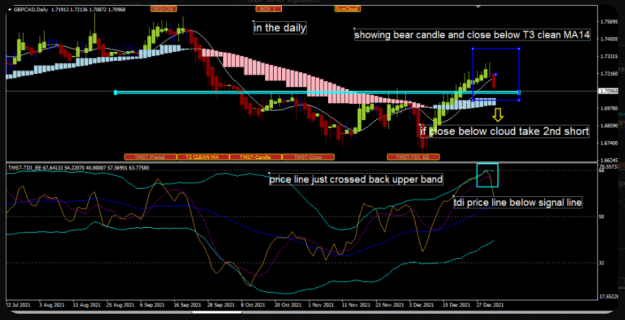
In addition for confirmation of the trend, using the T3 Clean MA14 , this is equivalent to (#1 best 5 ema tdi shift2) or using ema21. when price closed below , this confirms a short trade or down trend; and price closed above for long trade or up trend.
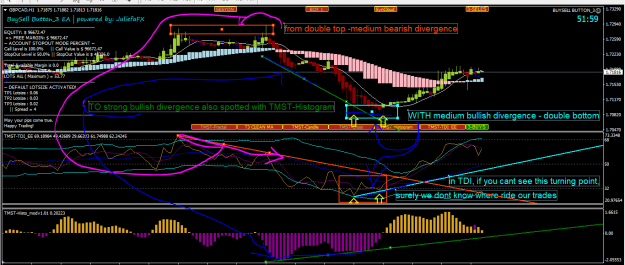
now, see where it goes. from double tops -medium bearish divergence to strong bullish divergence with TMST-Histogram that not seen or formed in TDI, but wait, we have a bit for TDI, a double bottom-medium bullish divergence that tells us the turning point to buy or take long trade.
did you take ride with MMM? if thats the case, then you WIN. 70 pips plus take profit with exact lotsize of your account.
Attached Image (click to enlarge)
thats it for now, see u in my next posts.
May your pips come true. Happy Trading and smile even if you loss. Just keep goin'.
somebody asked me about the indis/oscis or the tools i used and the strategy. its all in my posts the strategies that i used in trading crypto and forex.
i will be posting in the coming days. im preparing to upload so others may use it for free. only here in FF. thank you. and sorry if i offended someone. i decided to turned to commercial member for the limited time copy of my EA. but the rest, the indis/oscis, the tools can be downloaded for free. just finalizing the files to upload.
you can ask a one on one training in actual mode, from demo to live. just leave a message in the inbox. thank you.
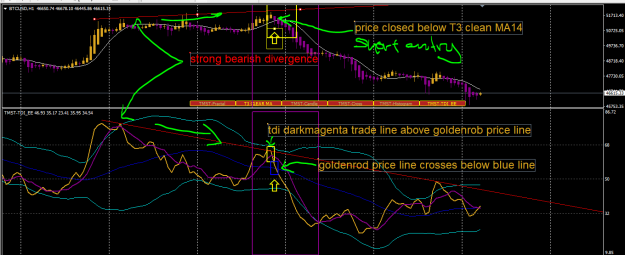
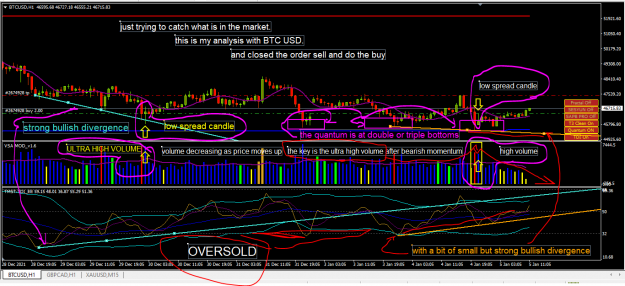
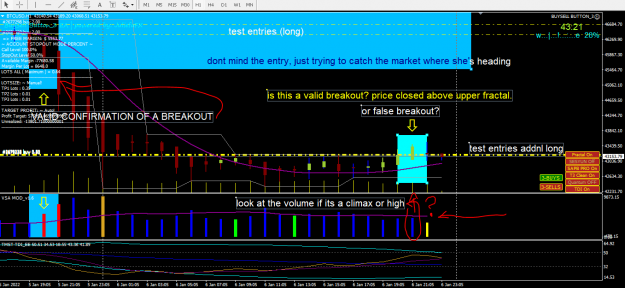
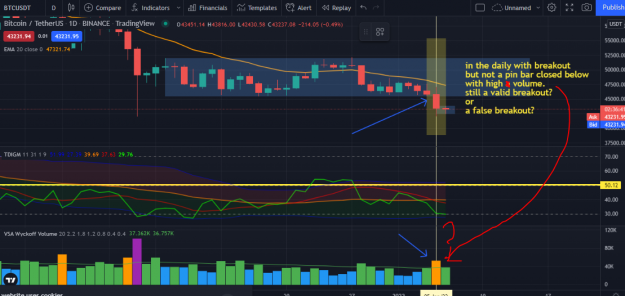
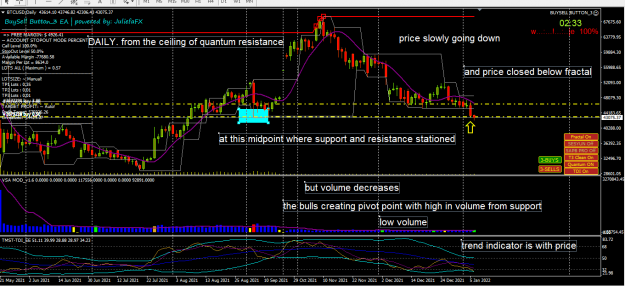
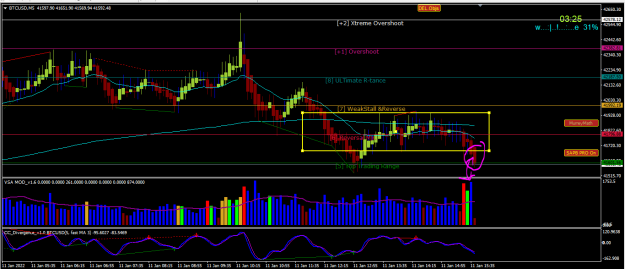
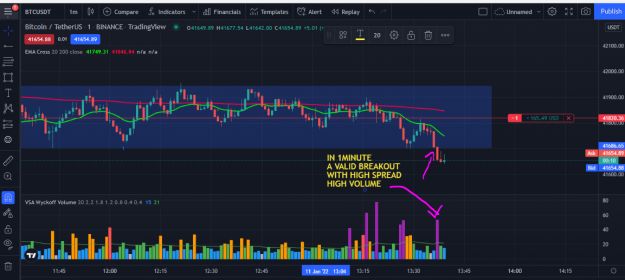
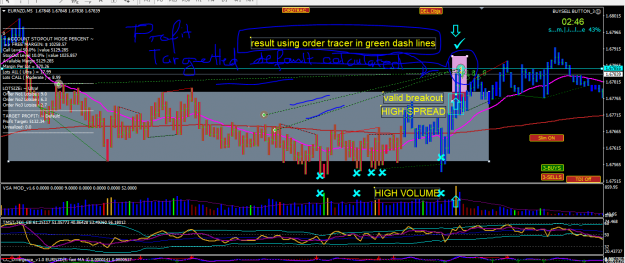
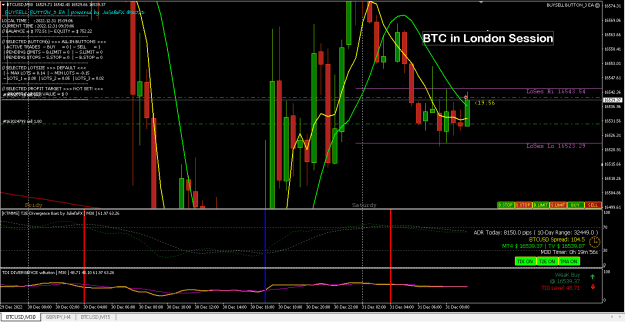
FOLLOW UP UPDATE BTCUSD PRICE ACTION AND VOLUME price action in range that we should try and understand and predict her action for breakout, if its a valid price or strong volume, or an invalid or weak volume lets look at this analysis and understand to have a good entry
in ranges; the planning of trades should have a strong price and strong volume in the breakout whether bullish or bearish direction. you can spot also too many wicks during ranges and many candles as majority whether bullish or bearish candles you can also spot alternation between bulls and bears dojis, pinbars are common and price overlapping each other, it means 2 candles with same highs and lows rejection from ema(i prepared 20 period or a t3 clean ma14) whether bull or bear candle, its like a spike or kick on the wall of a swimmer to push to a direction where it should be heading.
Attached Image (click to enlarge)
Attached Image (click to enlarge)
Attached Image (click to enlarge)
thats it for now. may your pips come true. happy trading.
RULES AND STRATEGY
first to look at is the asian session if greater or equal to 40 pips. if not, NO TRADE. stake to it. let the market come to you.
/ looking at the time frames:
1. for day trader- from 1hr - M15.
execution: M5.
2. for swing trader- from weekly - daily.
execution: H1.
3. for long trader- from monthly -weekly.
execution: daily.
/ and looking a sign of strength and weakness thru:
1. divergences
2. failure swing
3. breakout box in the 24 hour market cycle, you may start asian session or euro session or at 1700 hours new york session.
/ emas 20 and 200, if daily,h4,h1 are below 200 ema considered all trades in short, and above it all trades in long. (the keys are retest and rebound using ABC). breakout of 20 ema considered a false or true with ABC. volume and spread must be HIGH for valid breakout. if spread low-volume high invalid BO and vice versa.
/ and volume oscillator with TDI EXPLAINED see #post
/with BUYSELL BUTTON (optional)
this expert advisor is equipped with trailing stop profit target settings. you can set what you want up to 3 orders in one entry by simply setting true to it. same with take profit and stop loss you can set to true or open all for false with the back up auto of trail stop and profit target whether you set true or false for your TP and SL. our profit target can be set manually or in auto, by default if all are false, which is minimum. you can manually input lotsize, you can set to true for max or minimum lotsize. if lotsize and target profit set to false a default is given. make sure you set orders to true so that the button will enable to buy or sell.
in addition, hence, we put buttons to buy or sell for our orders to be executed by clicking it, in advance expert advisor will be added an input to set to true that will allow the auto trade by its conditions. so keep updated with this.
may your pips come true. happy trading.
free download
candles with candle timer in one
this is a modified version
HA ZONE
STRATEGY TESTER REPORT FOR BUYSELL BUTTON EA AUTO Selected and set to TRUE.
RSI REBOUND STRATEGY in 5 minute timeframe, spread 2, balance $500 with auto calculated lotsize, and trailing profit target manual setted. see post here results, report, and graph
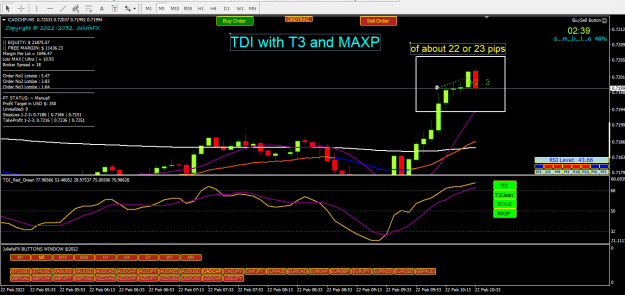
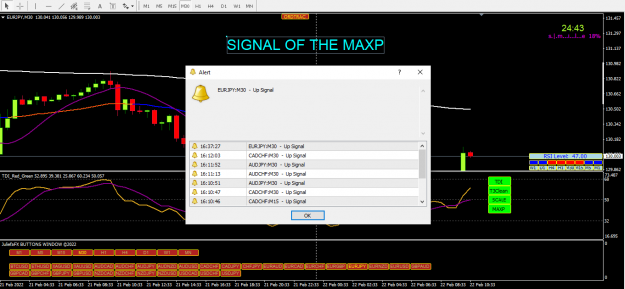
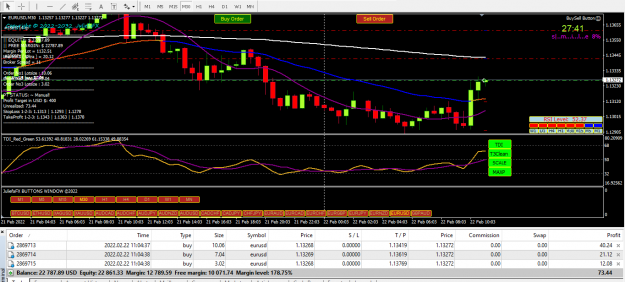
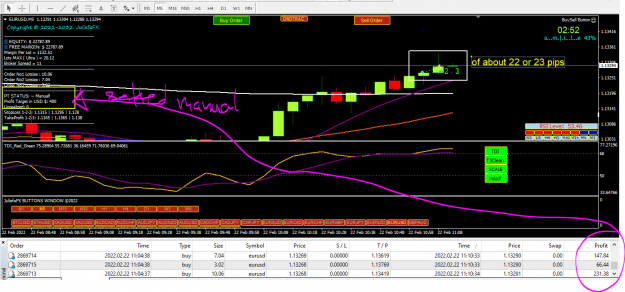
Trading Strategy with TDI accompanied by T3 and MAXP for confirmations entry with the use of BUYSELL BUTTON EA ~ manual with manual input Profit Target and set to 'True' with Trailing Stop in action.
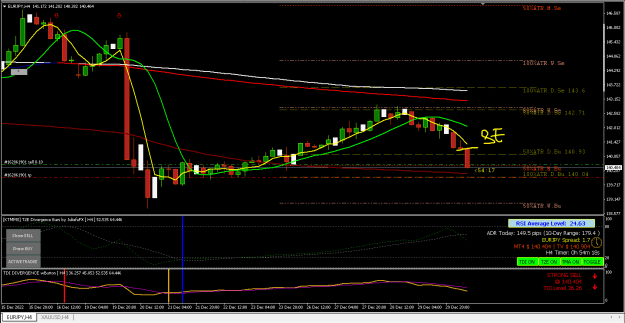
ALL JPY PAIRS, 7 all of them.
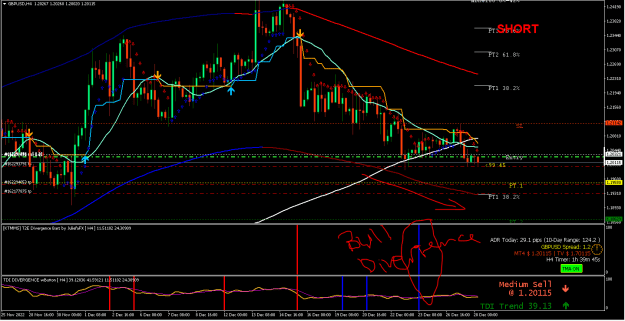
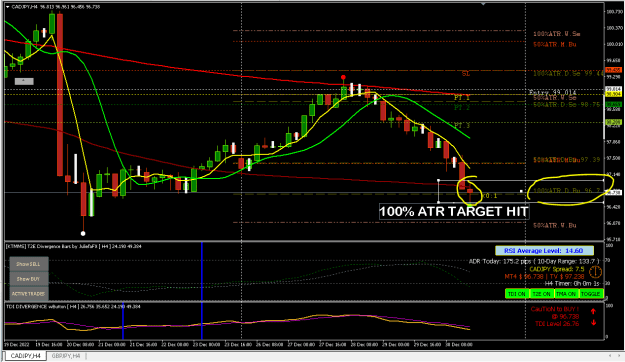
exact spot to place sell or pending order (sellstop)
and set take profit from 50% to 100% ATR level
lotsize: according to the account balance as calculated for lot size max & min.
reminder: dont mind the entries of the other pairs. just remember only the exact spot and the TPs given if you encounter a situation like this.
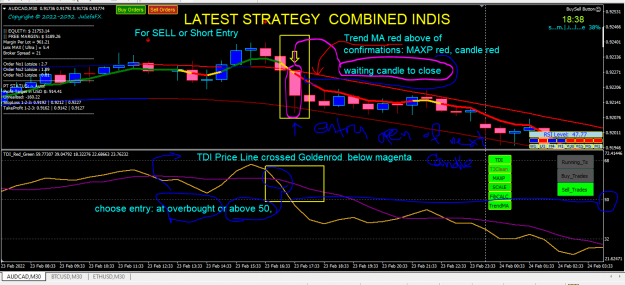
indicators signals and confirmed to take short. just a short period of time:
1. TMA red line down
2. with bullish divergence from TDI and T2E divergence bars
3. RSI Average Level almost at the extreme oversold
- expect fake breakouts below at the low of the recent swing low the creates a double bottom with fake breakout
and that commences the reversal to the upside.
signaling to take long. money makers are in position to take long after which ignites the oversold zone.
ALL JPY PAIRS, 7 all of them. exact spot to place sell or pending order (sellstop) and set take profit from 50% to 100% ATR level lotsize: according to the account balance as calculated for lot size max & min. reminder: dont mind the entries of the other pairs. just remember only the exact spot and the TPs given if you encounter a situation like this. indicators signals and confirmed to take short. just a short period of time: 1. TMA red line down 2. with bullish divergence from TDI and T2E divergence bars 3. RSI Average Level almost at the extreme...
Ignored
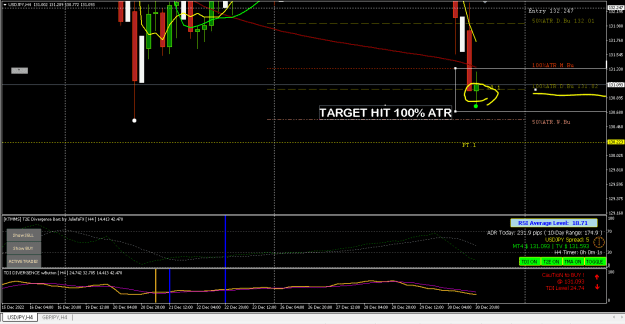
RESULTS as of Friday and the year 2022 ends with Big Wins... TARGET HIT 100% ATR except AUDJPY but still Win...
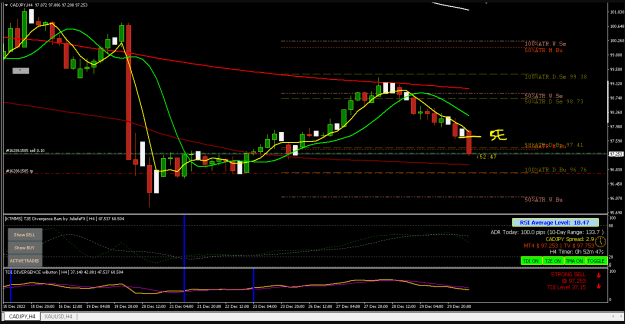
CADJPY
Attached Image (click to enlarge)
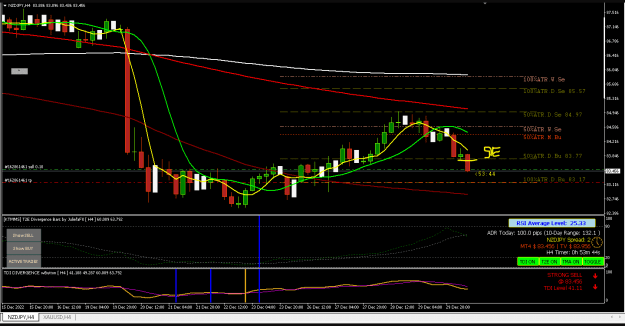
NZDJPY
Attached Image (click to enlarge)
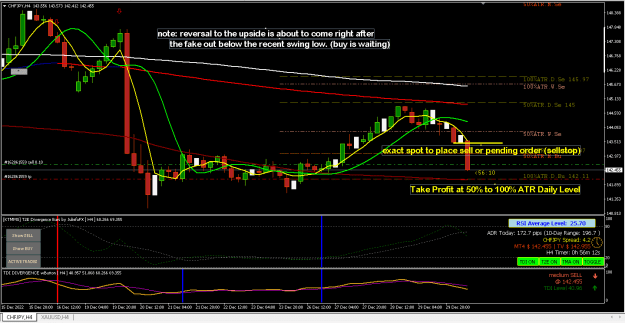
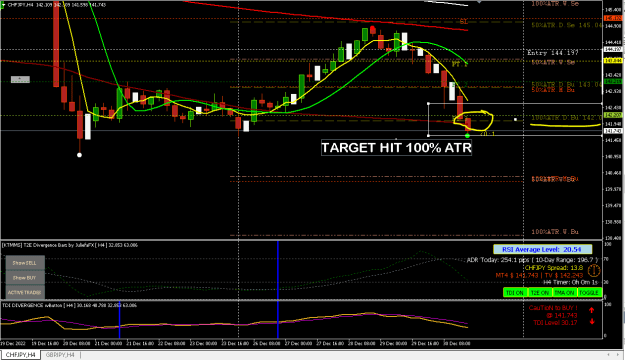
CHFJPY
Attached Image (click to enlarge)
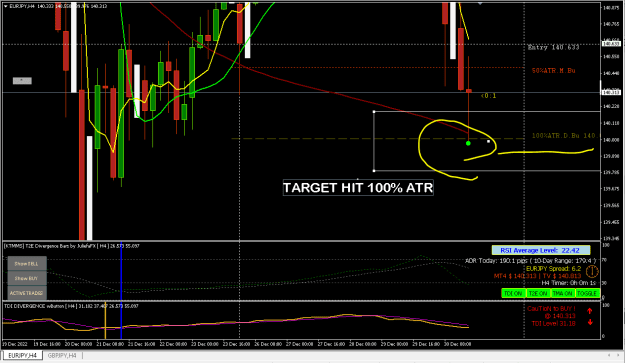
EURJPY
Attached Image (click to enlarge)
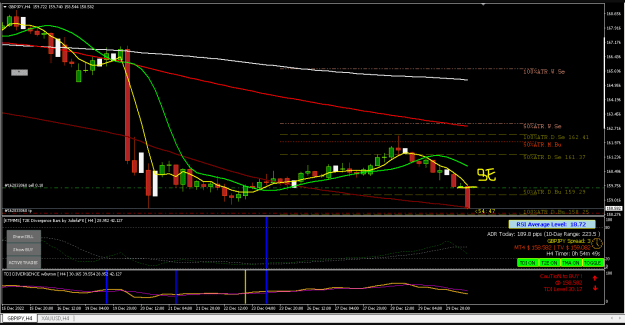
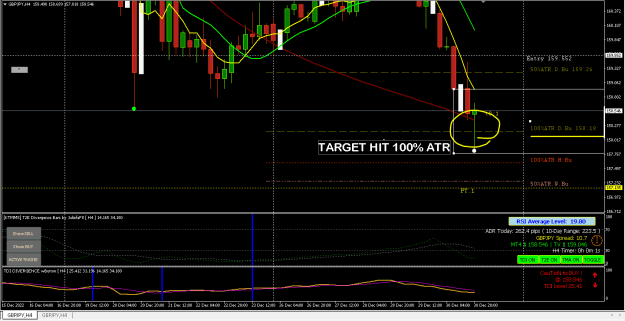
GBPJPY
Attached Image (click to enlarge)
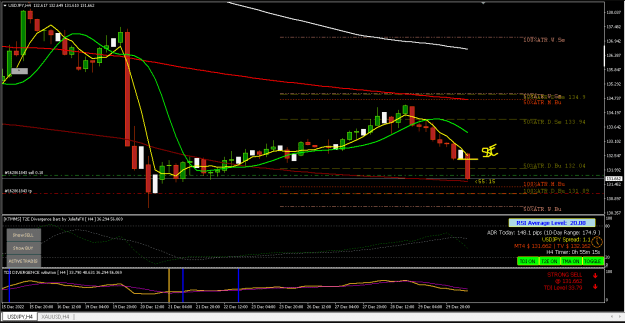
USDJPY
Attached Image (click to enlarge)
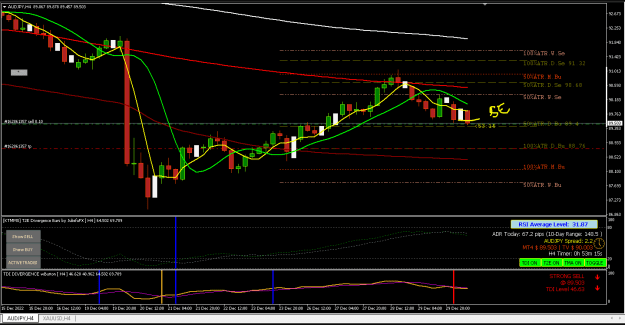
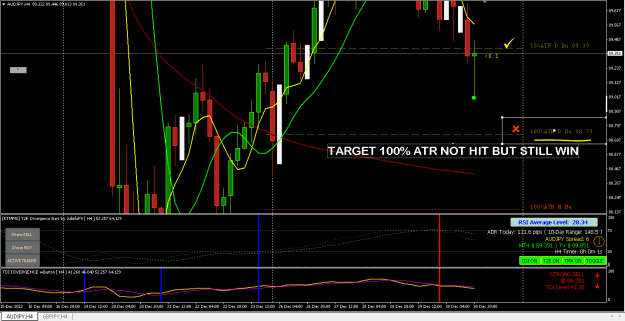
AUDJPY TARGET 100% ATR NOT HIT but still WIN..
Attached Image (click to enlarge)
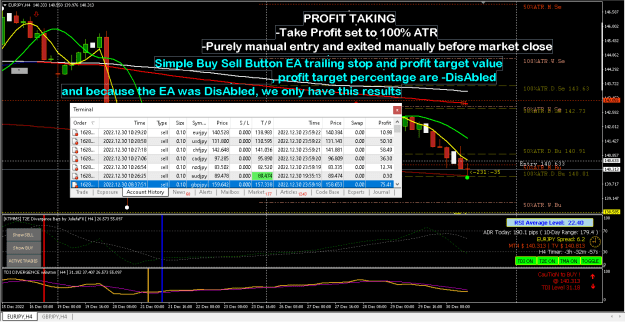
and because of the EA, the profit trail, profit target value, and profit target percentage was DisAbled.
we only have this results with manual exit before the market close.