Quantower is a fast, modern and powerful trading platform developed by Quantower company. Thanks to wide customization, modularity and progressive solutions, our trading software can meet the specific needs of even the most demanding traders.
The platform allows trading cryptocurrencies on various exchanges using advanced features for analysis and trading. At the moment the platform supports: 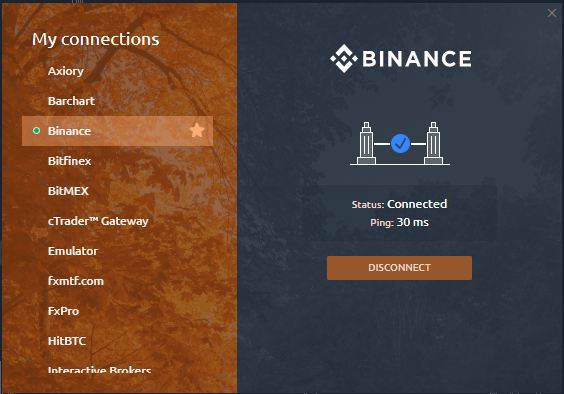
Quantower provides traders with a variety of advanced volume analyses features. It allows you to see the traded volume at each price level, assesses the balance between buyers and sellers and understands the intentions of traders regarding the future price.
Volume analysis tools include proprietary and well-known analytics:
— Cluster chart, known as Footprint
It allows to look inside the price and see all market actions. Cluster chart combines several important characteristics like time, OHLC prices, trading volume, number of buy and sell trades.
— Volume Profile: Step profile, Right & Left profile, Custom volume profile
Volume Profile displays the trading activity over a specific time period at certain price levels. Volume profiles are horizontal histograms that show the distribution of selected volume data for each price level. This allows you to more accurately see the zones of maximum trading interest, and as a consequence, the “true” support/resistance levels.
— Time Statistics, known as Bar Statistics
It’s a remarkable functionality that shows extended volume statistics for each individual bar — Total volume, Trades, Buy and Sell volume, Delta, as well as custom filters. For example, you can see how many buy or sell trades have passed in one candle from the total trading volume, assess the delta and the average trade size.
— Time Histogram
Time Histogram is similar to Time Statistics tool that shows volume data as a vertical histogram for each bar. But unlike Time statistics, it allows you to visually evaluate the data for each bar, not only by colors but also by the shape of the histogram.
Order Flow Analysis is a trading method that allows you to predict the actions of large market participants, as well as their intentions regarding the future price.
Using the Order Flow Surface panel, a trader sees all changes of limit orders in the Order Book (depending on the depth of market data), which is presented as a Heatmap. The panel shows the placement of limit orders, their changing, canceling or execution by large market participants, as well as the imbalance between buyers and sellers.
Unlike other types of charts, such as Footprint (or Cluster chart), the Order Flow shows not only aggressive market orders but also limit orders, which have a greater influence on the price behavior.
You can download the platform on the official website https://www.quantower.com
The platform allows trading cryptocurrencies on various exchanges using advanced features for analysis and trading. At the moment the platform supports:
- trading connections to Binance, HitBTC, Poloniex
- market data connections to Kraken, BitMEX, Bitfinex
Attached Image
Quantower provides traders with a variety of advanced volume analyses features. It allows you to see the traded volume at each price level, assesses the balance between buyers and sellers and understands the intentions of traders regarding the future price.
Volume analysis tools include proprietary and well-known analytics:
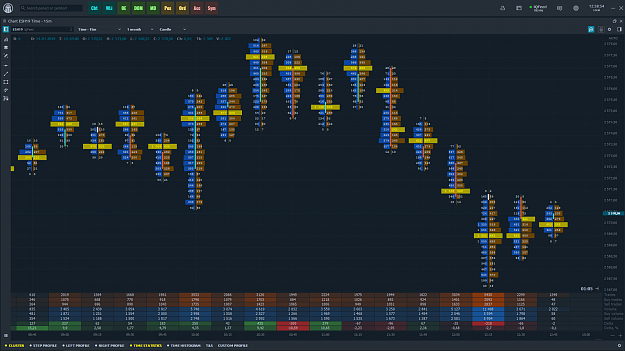
— Cluster chart, known as Footprint
It allows to look inside the price and see all market actions. Cluster chart combines several important characteristics like time, OHLC prices, trading volume, number of buy and sell trades.
Attached Image (click to enlarge)
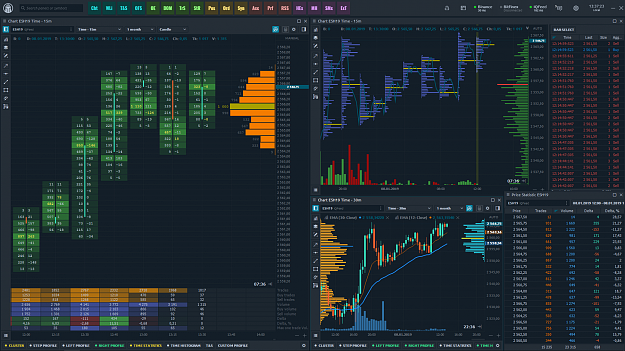
— Volume Profile: Step profile, Right & Left profile, Custom volume profile
Volume Profile displays the trading activity over a specific time period at certain price levels. Volume profiles are horizontal histograms that show the distribution of selected volume data for each price level. This allows you to more accurately see the zones of maximum trading interest, and as a consequence, the “true” support/resistance levels.
Attached Image (click to enlarge)
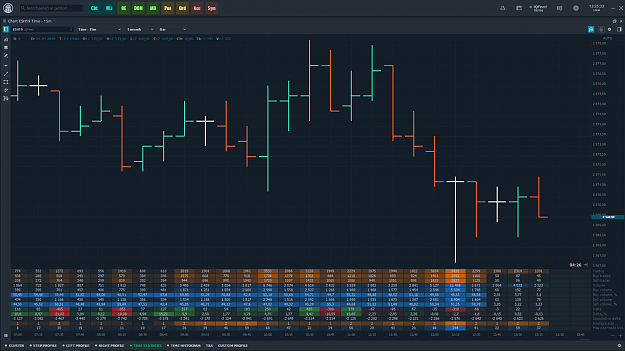
— Time Statistics, known as Bar Statistics
It’s a remarkable functionality that shows extended volume statistics for each individual bar — Total volume, Trades, Buy and Sell volume, Delta, as well as custom filters. For example, you can see how many buy or sell trades have passed in one candle from the total trading volume, assess the delta and the average trade size.
Attached Image (click to enlarge)
— Time Histogram
Time Histogram is similar to Time Statistics tool that shows volume data as a vertical histogram for each bar. But unlike Time statistics, it allows you to visually evaluate the data for each bar, not only by colors but also by the shape of the histogram.
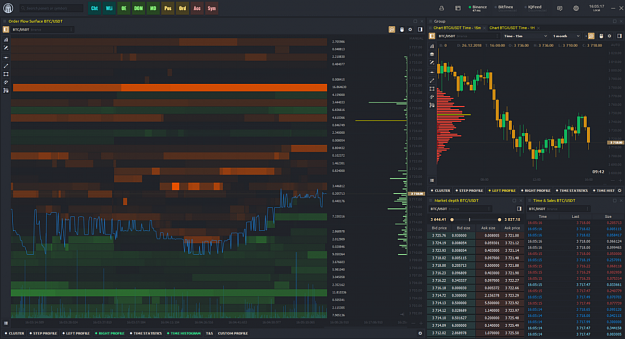
Order Flow Analysis is a trading method that allows you to predict the actions of large market participants, as well as their intentions regarding the future price.
Using the Order Flow Surface panel, a trader sees all changes of limit orders in the Order Book (depending on the depth of market data), which is presented as a Heatmap. The panel shows the placement of limit orders, their changing, canceling or execution by large market participants, as well as the imbalance between buyers and sellers.
Unlike other types of charts, such as Footprint (or Cluster chart), the Order Flow shows not only aggressive market orders but also limit orders, which have a greater influence on the price behavior.
Attached Image (click to enlarge)
You can download the platform on the official website https://www.quantower.com
Trading Platform for Forex, Futures, Stocks, Options, Crypto