Here is the #ZRXUSD chart. It mixes data from 3 exchanges. Period 8h.
Green Zones - the zones where ZRX is acting stronger than Crypto TOTAL index (blue line).
Red Zone - the time where ZRX is acting weakner than Crypto TOTAL index.
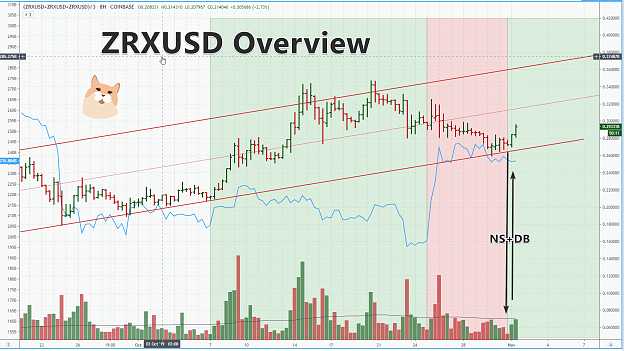
We have recently the changing in relationship between ZRX and TOTAL Index. While blue line keeps horizontal movement, ZRX is printing the second strong green bar. Note:
- bottom line of the channel confirmed its supporting impact as price bounce up from it.
- we have NS+DB sequence during the change. It means - sellers dissappeared and buyers entered the market to push price higher.
What is next?
- we should expect reaching a center line of the channel (at least).
- if price will decline toward the bottom line of channel - it would mean the incapable of bulls to drive price higher in favorable conditions. Fail of bulls = Bearish indication. In this case, breakdown of bottom line should be a logical development.
Green Zones - the zones where ZRX is acting stronger than Crypto TOTAL index (blue line).
Red Zone - the time where ZRX is acting weakner than Crypto TOTAL index.
Attached Image (click to enlarge)
We have recently the changing in relationship between ZRX and TOTAL Index. While blue line keeps horizontal movement, ZRX is printing the second strong green bar. Note:
- bottom line of the channel confirmed its supporting impact as price bounce up from it.
- we have NS+DB sequence during the change. It means - sellers dissappeared and buyers entered the market to push price higher.
What is next?
- we should expect reaching a center line of the channel (at least).
- if price will decline toward the bottom line of channel - it would mean the incapable of bulls to drive price higher in favorable conditions. Fail of bulls = Bearish indication. In this case, breakdown of bottom line should be a logical development.
Oleg Alexandrov, market analyst. Find me in Google