- Search Crypto Craft
- 42 Results
-
 zorndyke replied Apr 10, 2019
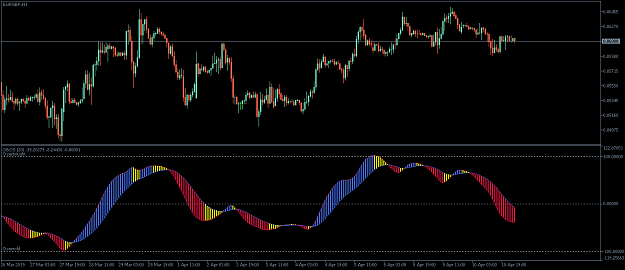
Thankyou @JoeeF for the hardworks converting indie to MT5 i have a request, please mod this mt5 indie by adding an alert when crossing file image and if possible could you convert it to MT4 ? thanks in advance
MT5 Indicators and EAs
- zorndyke replied Nov 5, 2018
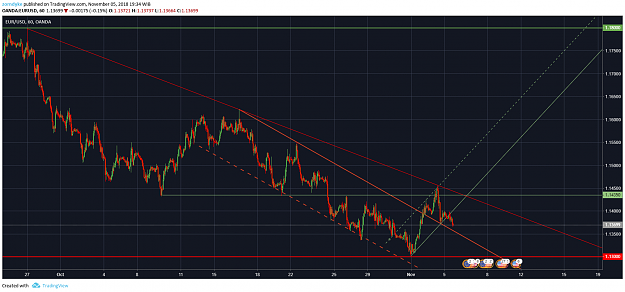
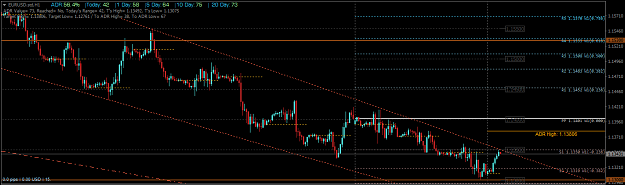
EU, after struggle to break round number 1.1400 for a week, on 1 November it was finally breaking the orange trend line, giving hope for buyer, but it was a false hope. 12 hours later (50 pips) it touching the red trend line and keep falling down ...
Trend Trading
- zorndyke replied Nov 1, 2018
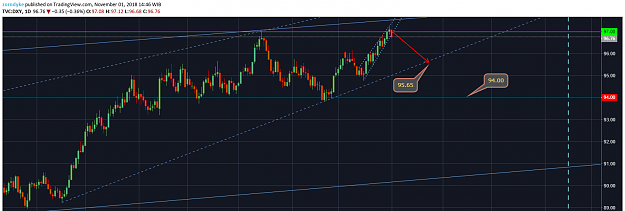
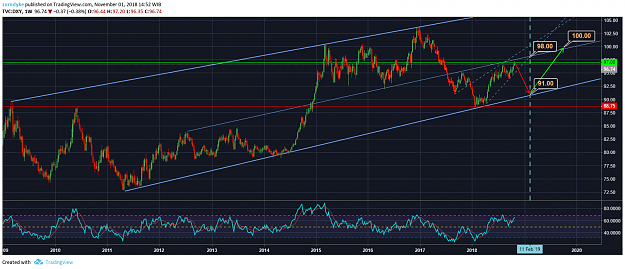
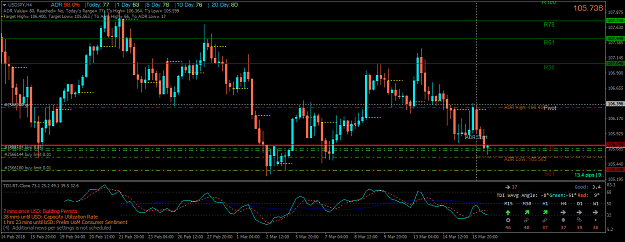
i think it seems king dollar just reach the peak and start weakening, i just cut all my 'red-pips' pairs against USD. now i need to reconsider different scenarios USD keep falling to lower trendline about 96.50 or to support line 94.00 image ...
Trend Trading
- zorndyke replied Nov 1, 2018
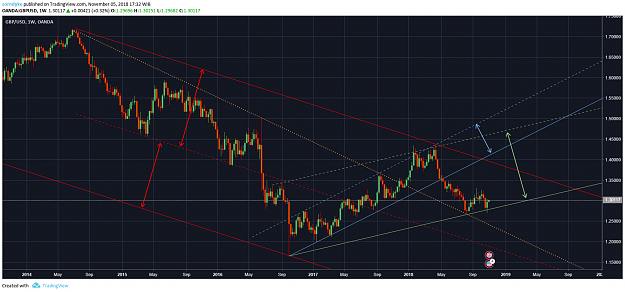
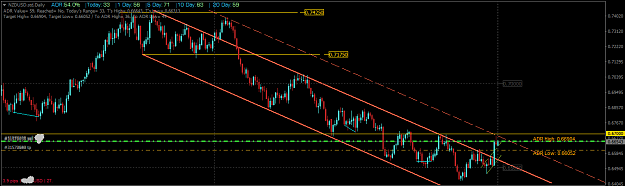
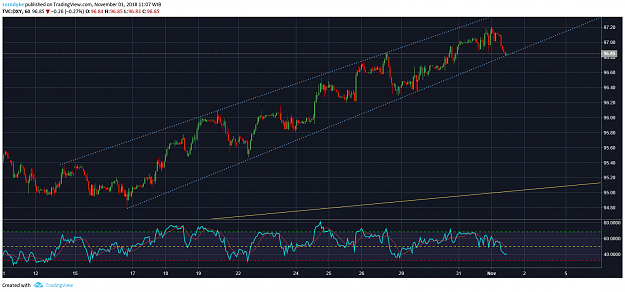
i hope i draw this trend line in the right way USD index 1H now touching the lower trendline. image as opposed of EUR/USD, also show the top of the trendline 9and (round number 1.1350) image edit : it's breaking the bottom trendline (4H or ...
Trend Trading
- zorndyke replied Oct 8, 2018
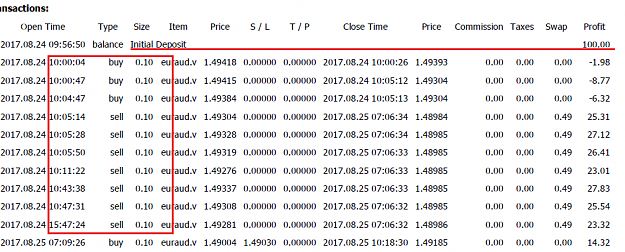
you're talking about risk and money management in 1st post, then i read your statement history. starting from 100 USD and open trade with 0.1 lot x 10 in an hour, that's gambling. image
A brief summary of what I learned in the past 17 years
- zorndyke replied Aug 6, 2018
thankyou sis DingDong, wish you always in good wealth and healthy.
Dashboard Trading
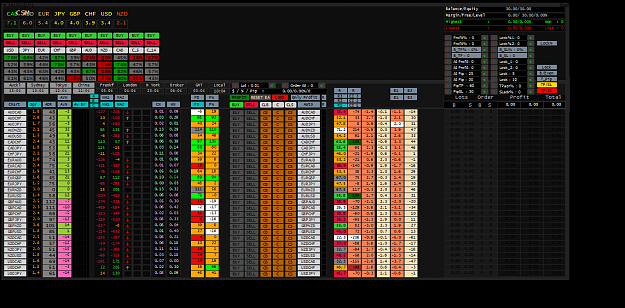
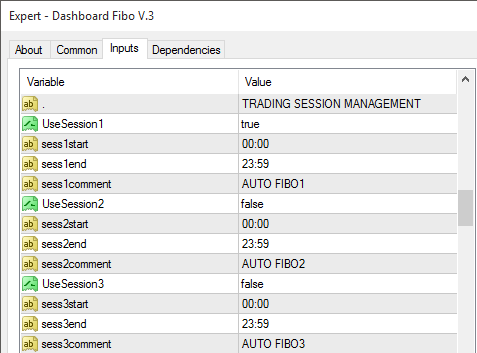
 edit : the new dashboard is different
  , i have tested it with 2 brokers and there are few things .... image ...
- zorndyke replied Jun 8, 2018
do not rely on divergence, remember a month ago and months before, how many divergence signal to long on xxxUSD ? my first analysts is geopolitical issue, then "semi"fundamental like news listed on forexfactory calendar, watch the Price (re)Action, ...
Pivot Trading
- zorndyke replied Jun 8, 2018
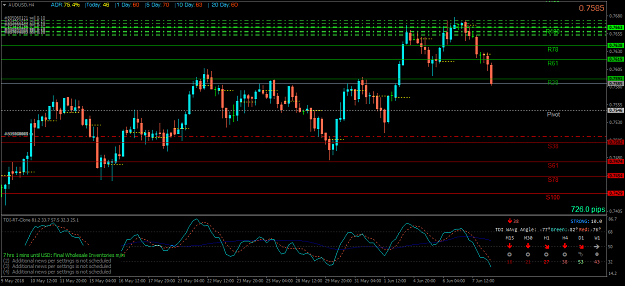
beautiful effect of the dovish RBA rate statement at june 5th. just as expected as my analysis before : url dovish rba + R100 + double top + D1 cypher pattern image
Pivot Trading
- zorndyke replied Jun 6, 2018
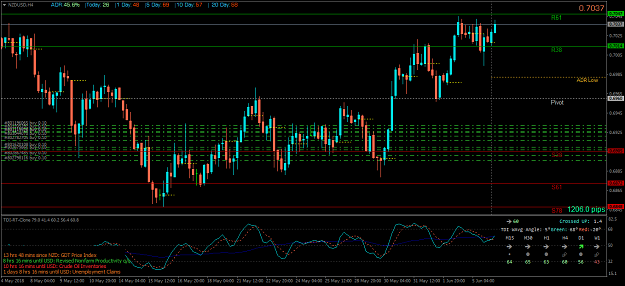
more than a week holding NU, i forgot what my decisions, but if im not wrong : US10Y didn't break and bounced at 3.1 USDX stop at 95.0 Fonterra increases milk price from 6.75 NZD/kg to 7$, lol
Pivot Trading close today because yesterday aud rate was ...
- zorndyke replied Apr 23, 2018
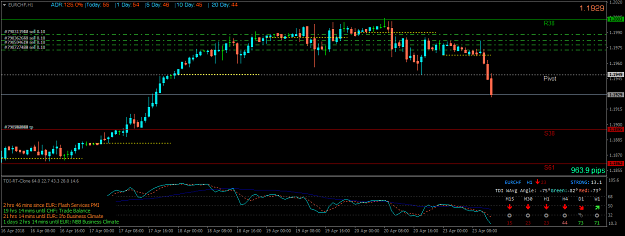
EURCHF since friday. is divergence & convergence still a thing ? image
Pivot Trading
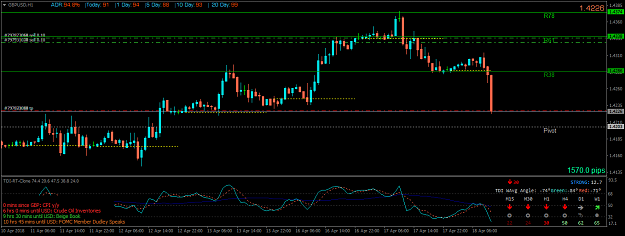
- zorndyke replied Apr 18, 2018
hit TP 1500 pips, will sell again at correction @ R38 image
Pivot Trading
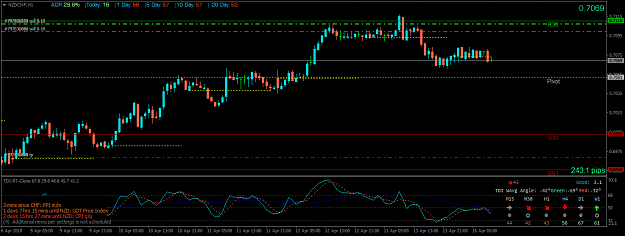
- zorndyke replied Apr 16, 2018
only 1 trade since Trump announce "mission accomplished" on Syria. i didn't know if this pair has something to do with syria crisis or not. But the PA gave me short signal image im waiting GBP and USD pairs to give me 'signal'
Pivot Trading
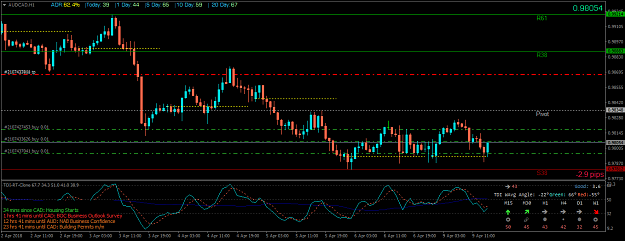
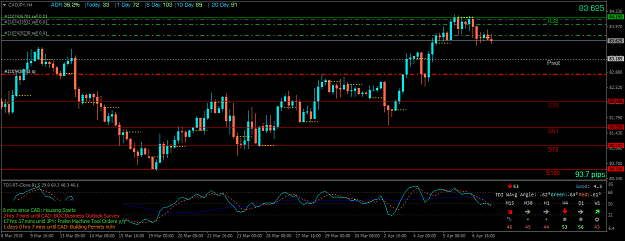
- zorndyke replied Apr 9, 2018
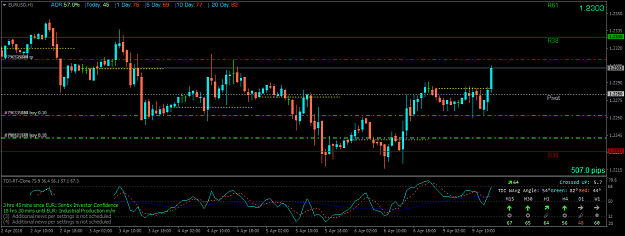
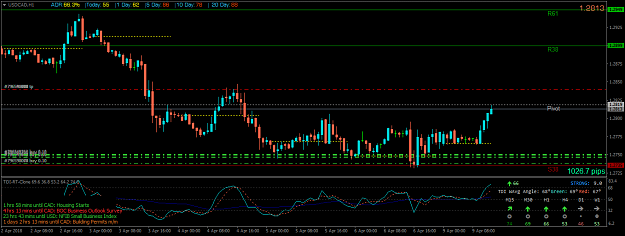
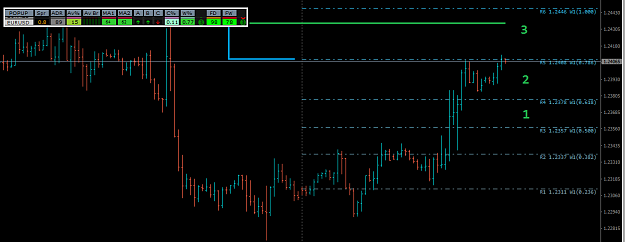
my trades since NFP, close 2, and still holding 2. and it seems all fibo line now 'recalculated' to R/S-38 selling CAD ? it was S-100 on friday and ranging since us close image selling CAD again @R-128 image short USD @R61 [closed this morning], ...
Pivot Trading
- zorndyke replied Mar 16, 2018
you have 3 not working indicators (newspanel, magnified market price, and pipscounter). re-download the files on page 1 bro ! trade for today, sell all JPY image image
Pivot Trading
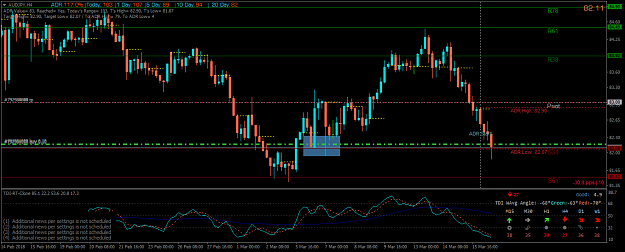
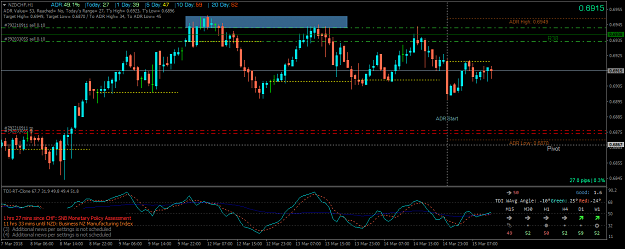
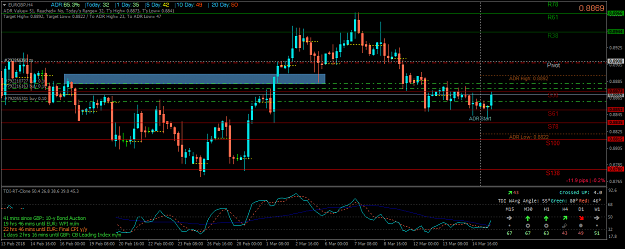
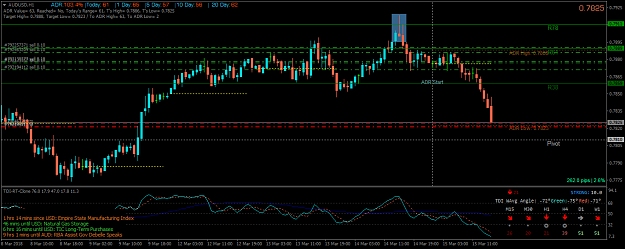
- zorndyke replied Mar 15, 2018
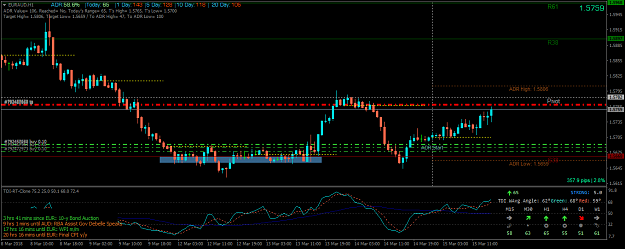
the example of good and bad decision : AUD/USD, short after pinbar @ R78 actually 2 trades executed @R61 before pinbar image EUR/AUD, long after sideway @S38, floating minus 25x5 pips yesterday. image NZD/CHF, no need explanation, range trading ...
Pivot Trading
- zorndyke replied Mar 14, 2018
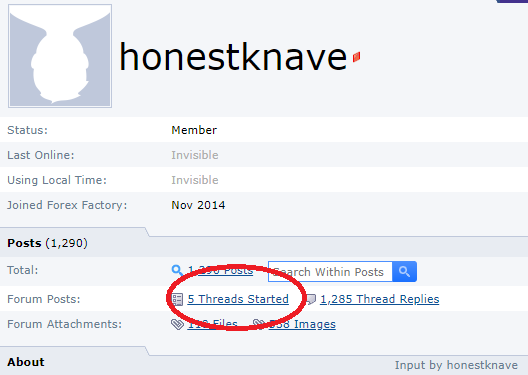
check out his profile ! and click the thread he's started. image
csDash (currency strength meter)
- zorndyke replied Mar 13, 2018
thankyou for the explanation sis DingDong, is cleear now, and i can adapt it with my strategy. now i can sleep well tonight
Dashboard Trading so to sum up : - the fibo on your dashboard is like fibo retracement tool for weekly & daily, it mean L=0, H=100, and ...
- zorndyke replied Mar 12, 2018
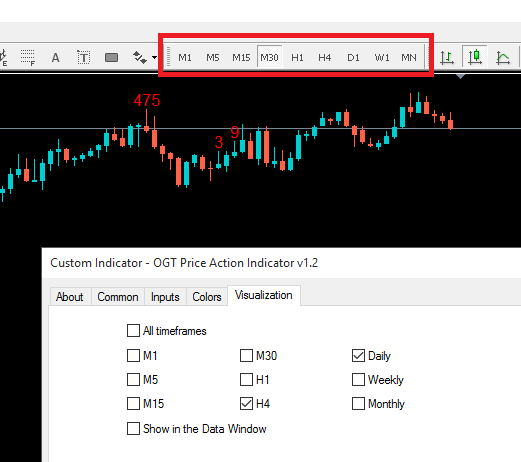
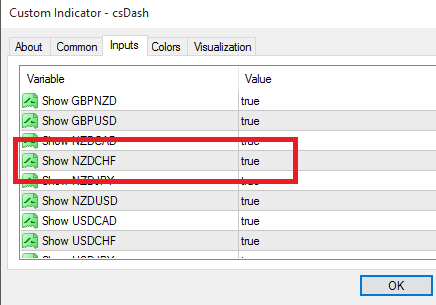
this indicator still showing on all TF image
Price Action System/Indicator