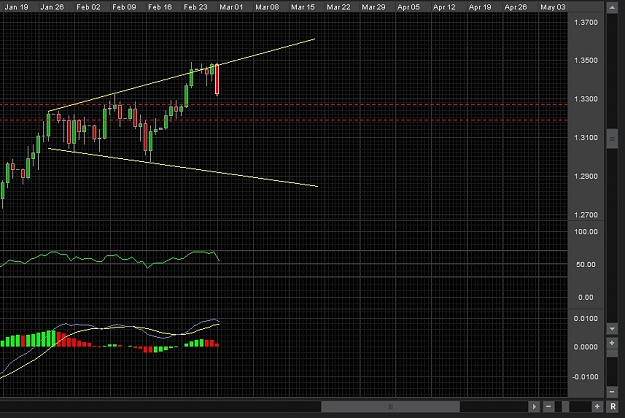
somebody asked what we're looking at in bigger time frame graphs. this is what I have been looking at since mid february. any comments from experienced traders? what are others seeing?